
Articles

The USGS Landsat Analysis Ready Data (ARD) Program
Landsat data, referenced with WGS84 and provided as GeoTIFF, can be accessed from EarthExplorer for the contiguous US, Alaska, and Hawaii.

The Brain Never Stops Making Maps
Researchers have found that even while they sleep, the internal maps of rats stay intact which enhances mental mapping.

Hurricane Ophelia is the Strongest Hurricane to Form East of the United States
On Saturday, October 15, 2017, Hurricane Ophelia strengthened to Category 3 status making it the first recorded eastern hurricane to be this strong.

Entire National Spatial Reference System (NSRS) to be Modernized in 2022
In 2022, the National Spatial Reference System (NSRS) is scheduled to be modernized, with new reference frames replacing the NAD 83 system and the North American Vertical Datum (NAVD) 88.

Mapping Global Forest Biomass
The European Space Agency is using satellite radar data collected from their satellites to measure how much wood is in the world’s forests globally.

Blooms and Scums in Lake Erie
This Landsat 8 satellite image captures a huge bloom that has been occurring in Lake Erie since mid-July, 2017.

How to Animate a Route on a Map Using Photoshop
Here is a step-by-step tutorial showing you how to animate a route on top of an image of a map using Photoshop.

Creating a Time Series Visualization of Two Decades of Changes in a Glacier
NASA has created a time series visualization of Greenland’s Helheim Glacier using 20 years of data from radar, lasers, and high-resolution cameras.
Tissot’s Indicatrix: Measuring Distortion in Map Projections
Tissot’s indicatrix is a mathematical contrivance used in cartography to characterize local distortions in map projections.

Mapping Noise Pollution
As noise pollution continues to be a major issue for expanding urban areas, novel geospatial technologies have been deployed to better monitor and measure noise pollution.
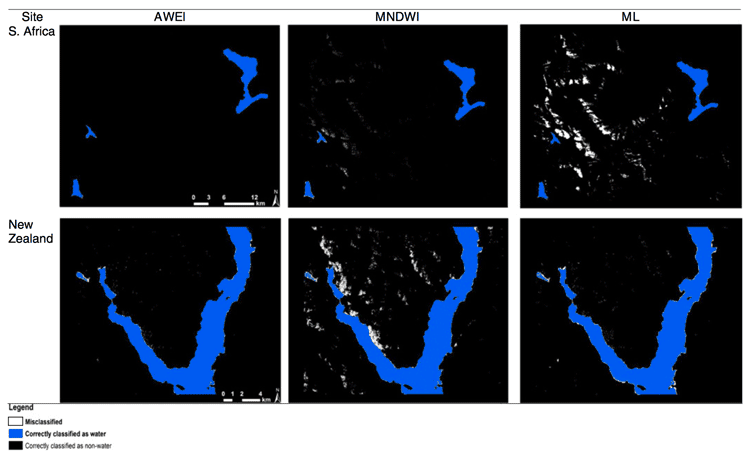
Automated Land Cover Maps
Automating the generation of land cover maps from satellite imagery is becoming easier due to learning-based algorithms improving the understanding of signal data.

Review | Oxford Atlas of the World, 24th Edition
G.T. Dempsey reviews the Oxford Atlas of the World. The 24th edition is scheduled to be published November, 2017.

Methods for Creating Cloud Free Satellite Imagery: Sentinel 2
Nearly 70% of the globe is covered by clouds at any given time. Several methods have been developed to remove cloud cover from satellite imagery.

GIS and Machine Learning for Habitat Protection
With gains in computational power and accessibility to off the shelf models, often used in commercial or open source software, applying machine learning techniques with GIS has become far easier for conservation and habitat specialists.

Open Data Site Established for Hurricane Harvey
An open data site has been set up to house GIS data from authoritative sources relating to Hurricane Harvey.

Tracking Hurricane Harvey with Satellites
Several satellites have been tracking and measuring the intensity of Hurricane Harvey.

Researchers are Using Machine Learning to Better Predict Weather Patterns
The enormous amount of data from Earth-observing satellites is pushing researchers to use machine learning to mine the information and improve climate models.

Can Painting City Streets Reduce the Urban Heat Island Effect?
The City of Los Angeles is experimenting with lowering the urban heat island effect by painting its streets a lighter color.
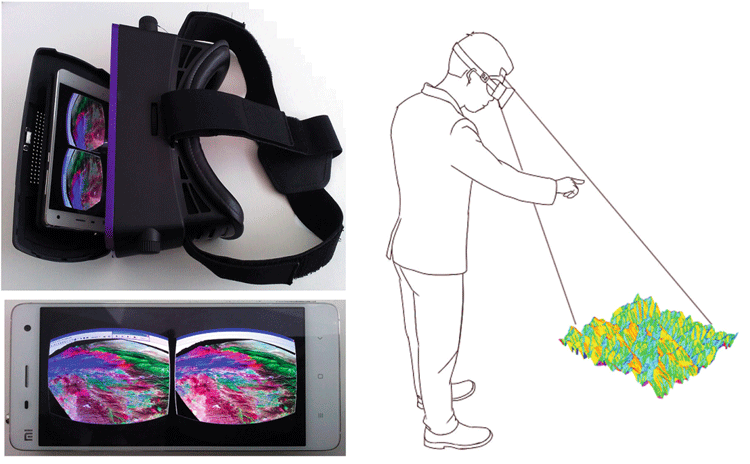
GIS and Virtual Reality
The integration of virtual reality (VR) with GIS is gaining traction in various areas such as urban planning and education.

Animated Map Shows Animal and Bird Migrations
Scientists modelled animal migrations based on global climate change patterns and created a map that showed potential future migrations of different species in North, Central, and South America.

How LiDAR is Being Used to Help With Natural Disaster Mapping and Management
Michael Shillenn, vice president and program manager with Quantum Spatial outlines three projects where LiDAR data from the USGS 3D Elevation Program (3DEP) has been used to assist in planning, disaster response and recovery, and emergency preparedness.
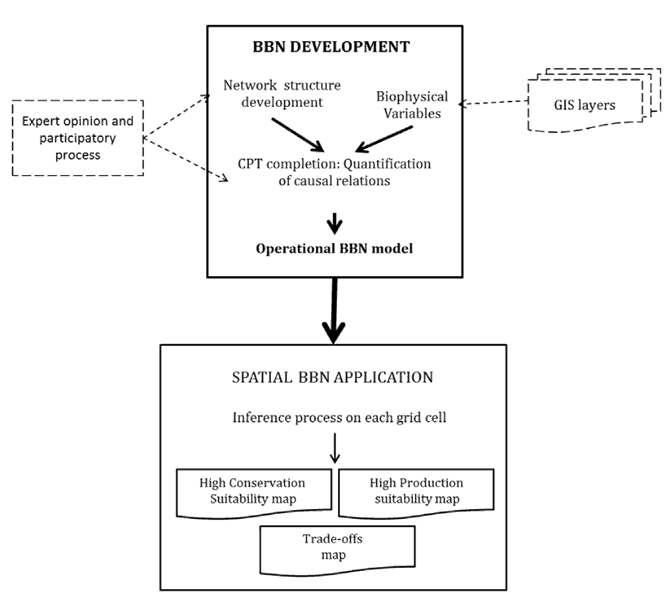
GIS and Bayesian Belief Networks
Bayesian belief networks (BBN) and GIS can be used as decision aides to give an idea of probability of events unfolding.

How Light Pollution Affects People and the Environment
While much of the public is aware of a concept of light pollution, its ill effects and influences on society and nature are less clear to most people.
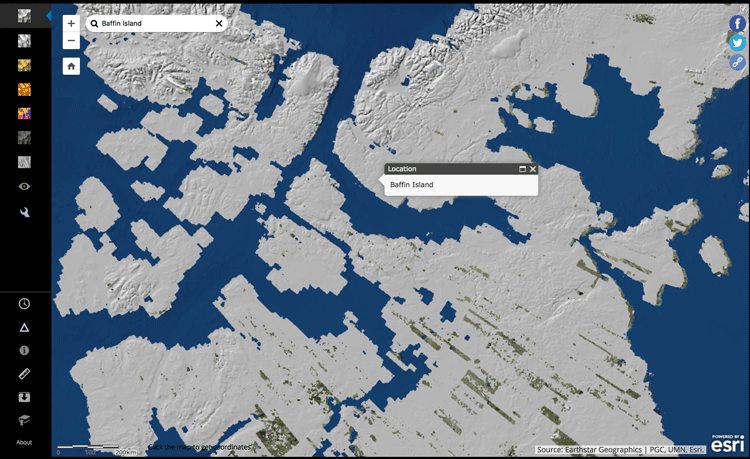
View Arctic Elevation Data with ArcDem Explorer
ArcticDEM is a project that is working to produce digital elevation models of the Arctic in order to see how topographical changes are occurring over time, such as the rate at which glaciers are receding.

Digitizing Errors in GIS
Digitizing in GIS is the process of converting geographic data either from a hardcopy or a scanned image into vector GIS data by tracing the features. Explained in this article are the types of common digitizing errors found when creating geographic data within GIS.

Where is Open Source GIS Going?
Mark Altaweel discusses the growth and direction of open source GIS tools and software in this opinion piece.