
Articles
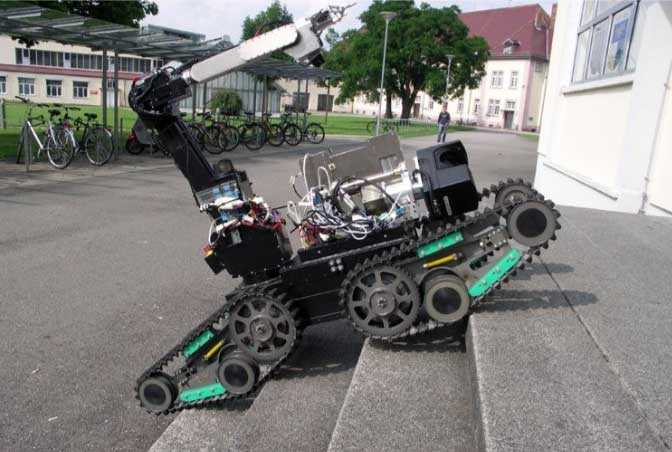
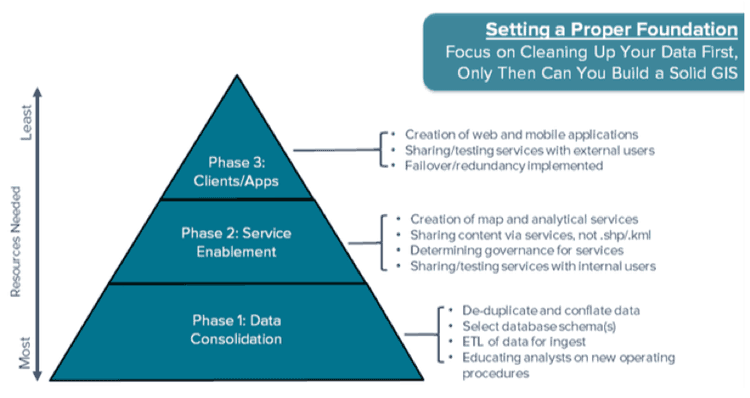
How Robots Can Help Improve GIS Data
Robotic platforms are actively used to collect spatial data, including GPS data, to help map floor plans and wider areas.

The Importance of Geomorphology for Physical Geographers
Geomorphology is the study of Earth’s landforms created by mostly physical processes.

Mapping Billions of Data Points in Milliseconds
With its GPU power, MapD can process and map billions of data points in milliseconds.

Using Geotagged Photos to Map Cats
I Know Where Your Cat Lives is a project that mapped out a million geotagged photos of cats from several social media platforms.

Helping Chimpanzee Conservation Efforts with Satellite Imagery
NASA has partnered with the Jane Goodall Institute to provide satellite imagery and the analysis needed to understand where habitat loss is the most extreme to protect chimpanzees in the wild.

Learn How to Access and Use Sentinel-3 Data
Learn how to download and use earth observation data from ESA's Sentinel-3 satellite.
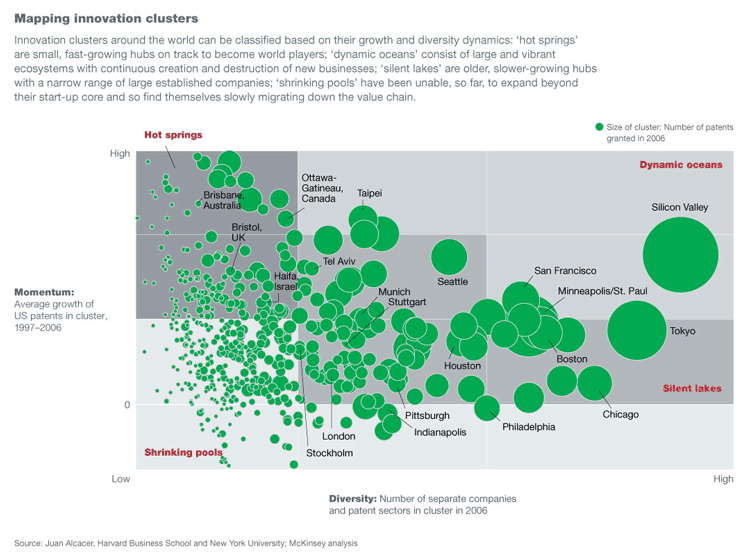
Geography of Innovation
By merging innovation theory with geography, researchers can explain why areas like Silicon Valley consistently lead in innovation.

Three Examples of Geospatial Innovation in Emergencies
Bailey Morton outlines three examples of how innovative geospatial analysis can help save lives in emergency situations.
Using GIS to Study Plant Behavior
The application of plant biology with GIS has potentially important implications for the study of plant behavior affecting important factors such as the Earth’s climate and agricultural supplies.

Using Machine Learning and Satellite Imagery to Estimate Corn Crop Production
Descartes Lab, a start-up organization, has created crop production analysis that uses millions of satellite images and machine learning to produce accurate data about the production of agricultural crops.

A Review of Timesheet.js
Timesheet.js is a basic tool calls a JavaScript file and uses a code-based configuration to create a simple timeline that can be embedded into a HTML file.

VANE Query Language: Intuitive Access to Satellite Imagery
Georgy Potapov of OpenWeatherMap introduces the release of the VANE language service, an entirely online service that presents a new concept for accessing satellite imagery. Potapov shares OpenWeatherMap’s vision of how developers can work with satellite and weather data to help the overall geoinformation market to grow.

Geography Mnemonic to Learn the Countries of Central America
Use a mnemonic to remember the countries of Central America in order from north to south: Belize, Guatemala, El Salvador, Honduras, Nicaragua, Costa Rica, and Panama.

Geography Mnemonics to Help Learn About the Great Lakes
Learning the names of the Great Lakes can be aided through the use of mnemonics, a learning device that uses patterns to help with recall.

How to Teach Children the Cardinal Directions
Here is a simple and effective tip for teaching children cardinal directions (north, east, south, and west).

GPS and a Grader Bring Back the Maree Man Geoglyph in Australia
The Marree Man is a geolyph located in the Australian Outback. A geolyph is an image or a picture that is a design in the earth, and it is usually made of natural materials.

Find Users of Open GIS Data from Around the World Thanks to the Center for Open Data Enterprise
The Center for Open Data Enterprise is working to improve the quality of open access data worldwide, including GIS data sources.

Using R with GIS Software
With the utility of R, many popular statistical procedures and more advanced analyses, including a variety of simulation applications, can be applied directly within GIS tools such as QGIS.

Geo Quiz: Name the Human Activity Visible from Space
This geography quiz features ten satellite images each showing an anthropogenic activity. Can you figure out what the human activity shown on each image is?

Using GIS to Assess and Mitigate Rail Hazards
GIS has been of interest to rail companies, NGOs, and governments attempting to minimize a variety of hazards that may affect the rail network.

Geography and Modern Slavery
Human geographers examine the interplay between economics, neoliberal capitalism, geography, and immigration to identify potential hotspots for human trafficking and slavery

GIS and Semantics: Enabling the Discoverability of Data
Much like the semantic web, methods exist in GIS to streamline the search of diverse geospatial data through certain protocols and standards.

Geo Quiz: Which Country is Bigger?
This quiz challenges you to figure out which country is bigger based on a world map using the Mercator map projection.

What Causes Gaps in the Clouds?
Air will rise and fall around large geographic features such as islands and icebergs, affecting the formation of clouds.
Harness the Power of Open Source GIS with a Hybrid Architecture
Anthony Calamito, Chief Evangelist at open source GIS company, Boundless, explores how companies can harness the power of their open source GIS systems.

Changing Map Scale Using a Pantograph
A pantograph was one of the ways used to either reduce or enlarge the size of a map while reproducing an accurate copy of the original map.