
Caitlin Dempsey

Camels Now Part of Google’s Street View Imagery Program
Google uses many different ways to capture its growing street level imagery, including using trikes, snowmobiles, and trolleys. Most recently, ...

Was an Inaccurate Map Partly Responsible for Napoleon’s Waterloo Defeat?
A French documentary filmmaker argues that a cartographic mistake played a significant role in Napoleon's army succumbing to defeat by the Duke of Wellington's forces in the Battle of Waterloo.
How Does a Degree in GIS Affect How You Feel About Your Career?
Salary site payscale.com released the results of its 2014 college survey that looks at which college majors pay the best and are ...

New Detailed Map of the Ocean Floor
More than two-thirds of the earth’s surface is covered by deep oceans, yet researchers know one hundred times more about ...

Work on “Inner GPS” in the Brain Wins Nobel Prize in Medicine
Over the course of three decades, two separate research efforts helped unwrap the questions of “how does the brain create ...

How Many Lakes are There in the World?
Using high-resolution satellite images, researchers created the GLObal WAter BOdies database (GLOWABO), which includes all lakes larger than 0.002 km2.
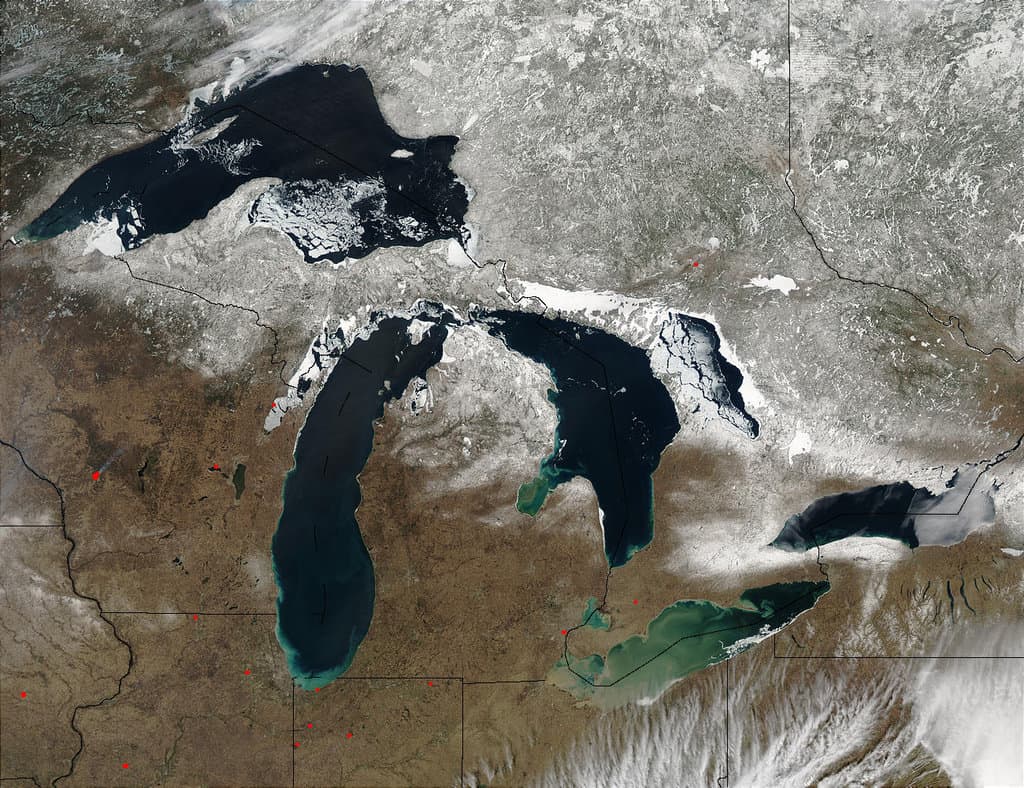
GLOWABO – Remotely Sensed Inventory of the World’s Lakes
A team of researchers used remote sensing techniques to calculate the number of lakes in the world.

Improved and More Realistic Minecraft Map of Great Britain
An improved Minecraft map of Great Britain has been released by the Ordnance Survey.

Measuring Small Variations in the Earth’s Gravity
The NASA–German Grace satellites were launched in May of 2002 in order to map variations in Earth's gravity field.

Measuring Carbon Dioxide and Nitrogen Dioxide Trends with Remote Sensing
Researchers from the University of Bremen published in Nature Geoscience the results of an effort to implement a top-down approach using data acquired remotely.

National Geospatial-Intelligence Agency’s Web Mercator Advisory Notice
The National Geospatial-Intelligence Agency (NGA) has an advisory notice warning about errors in the widely used Web Mercator map projection.

Aral Sea Continues to Shrink
Once the fourth-largest inland water body in the world, the Aral Sea shrank again in 2013
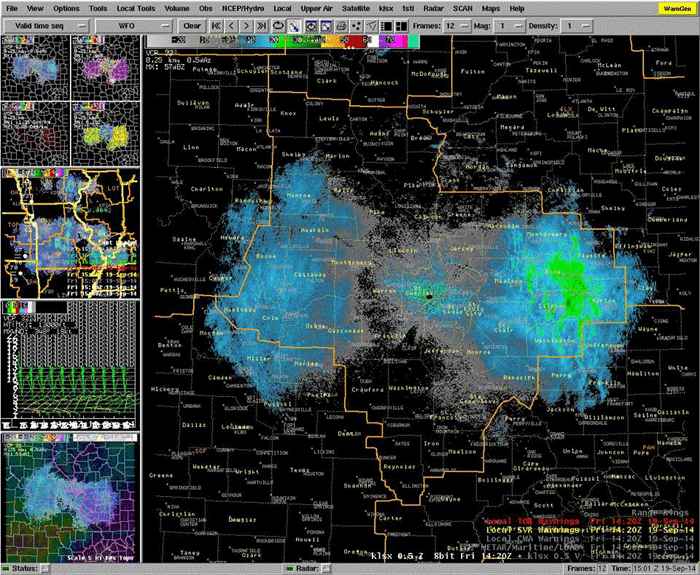
Mass Movements So Large You Can See Them on Radar
The U.S. National Weather Service in Saint Louse, Missouri recently reported that a butterfly shaped pattern on its radar was the result of... butterflies.
Is GIS Use in Crime Analysis Effective at Curbing Crime?
A new study by researchers at Sam Houston State University found that the use of GIS is widespread in analyzing crime ...

Tracking the Evolution of the Field of Geography over 124 Years and 10,290 Dissertations
Kent State University professors David Kaplan and Jennifer Mapes have undertaken a study to understand how academic research in the field of geography has evolved in the United States.

Mapping Global Carbon Dioxide Emissions
Researchers recently published the results of developing a system for measuring global carbon dioxide (CO2) emissions in the Journal of Geophysical ...

How Much do Geographers Make?
Geographers find work in a variety of disciplines both in the physical and human geography related fields. Geographers are employed ...

Map Orientation
Maps have not always been orientated northward. Different regional and religious forces have influenced the orientation of maps over time.

Mapping Forest Disturbance with Landsat
The Landsat Ecosystem Disturbance Adaptive Processing System (LEDAPS) takes advantage of the 30 year Landsat archive to inventory recent disturbances and forest-cover change.

Mapping Iceland’s Bárðarbunga (Bardarbunga) Volcanic Eruption
The second highest mountain in Iceland has been exhibiting heightened activity since mid-August. As a results causing thousands of local ...

Some Common Spatial Analysis with Raster Data
Spatial coincidence, proximity, surface analysis, dispersion, and least-cost path analysis are some common spatial analysis done with raster GIS data.

Using Social Media to Track Global Eating Habits
According to researchers, social media can be used to track and understand eating habits from around the world. These researchers ...

How to Make a Map from a Shapefile Using Google Fusion Tables
This tutorial shows you how to make a map in Google Fusion Tables with shapefile data.

How to Make a Map with Excel Data Using Google Fusion Tables
This article will take you though a step-by-step example of using an Excel spreadsheet that contains location information to make a map using Google Fusions Table.

Geography of Car Thefts in the United States
The National Insurance Crime Bureau (NICB) each year takes a look at the national picture in terms of car thefts.

Geography of Impact Craters
According to the Earth Impact Database, there are currently 184 verified impact craters that have been documented on Earth.