
Caitlin Dempsey
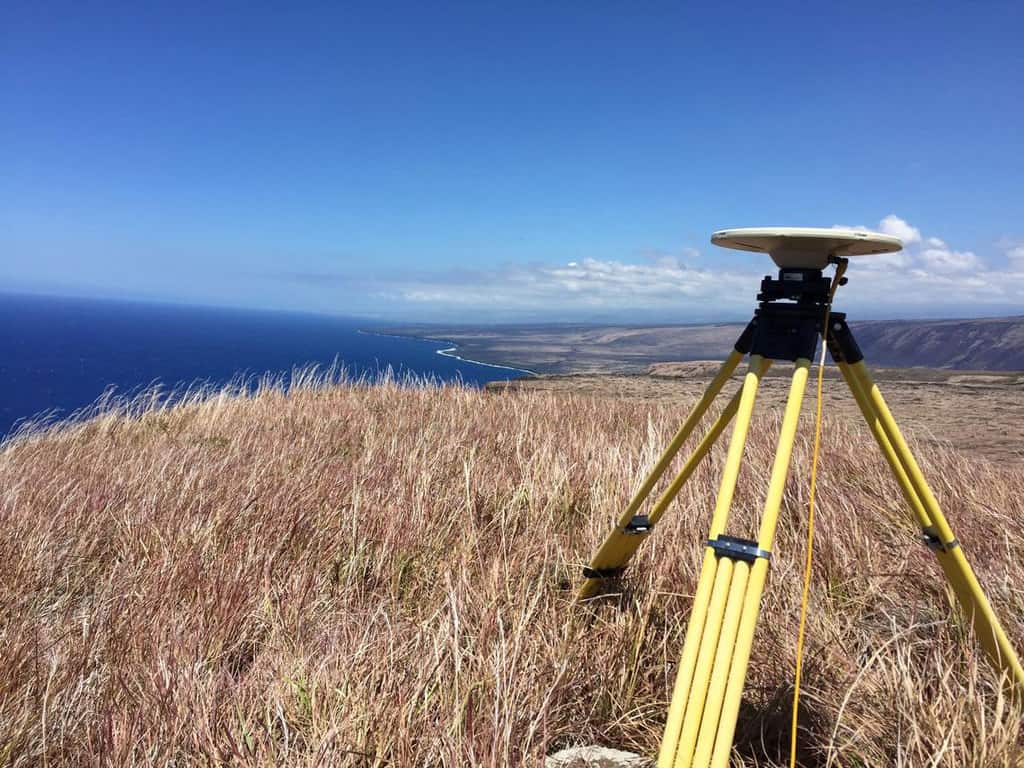
Fun with GPS
A multitude of games and alternatives have emerged to capitalize on the affordability of handheld GPS units.

Using GIS to Identify Milwaukee’s Homeless Population
GIS Cloud has developed a mobile GIS and mapping app that allows for the collection of information about homeless populations in the City of Milwaukee in Wisconsin.
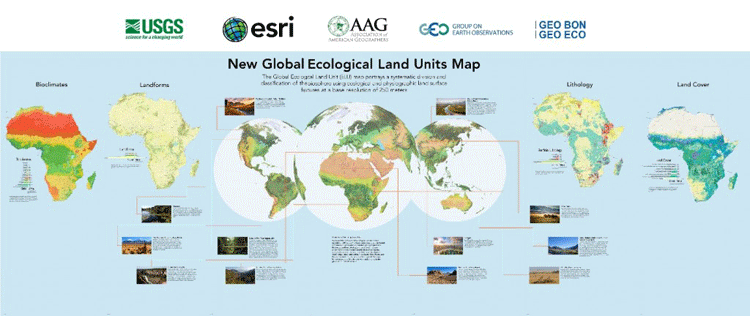
Global Ecological Land Units Map
Esri and the United States Geological Survey (USGS) have developed the highest spatial resolution ecological land units (ELUs) map of the world commissioned by the intergovernmental Group on Earth Observations (GEO).

GISconnector for Excel – Synchronize Data, Selections, and Filters between ArcGIS and Excel
A new tool is available called GISconnector for Excel which enables bidirectional data transfer between ArcGIS and Excel. The tool, GISconnector, also ...

Generalization in GIS
Generalization is the method used in GIS to reduce detail in data. Learn about how to generalize GIS data using QGIS, ArcGIS, and other software tools.

Mapping Digital Attacks Around the World
The site Digital Attack Maps shows the leading Distributed Denial of Service (DDoS) attacks happening at the moment.

Latest Release of MapInfo Focuses on an Easier to Use Mapping Experience
Pitney Bowes, the maker of MapInfo, has released an updated version of the GIS software that is aimed towards lowering ...

Mastering Geography
Here are some people who have amazing memories when it comes to geography.

Using Geospatial Technologies to Map Illegal Fishing
Worldwide overfishing is having a devastating effect on marine ecosystems. A 2014 report from the United Nations Food and Agriculture Organization ...

Continents and Population Density
The worksheet below is aimed towards helping elementary school students uses graphs to learn about the different continents and the ...

Mapping the California Drought with Open Data
The Center for Integrated Data Analytics (CIDA) of the United States Geological Survey has created an open source visual description of California's ongoing drought using free and publicly available GIS data sources

Finding Low Tech Solutions for Nairobi’s Commuters
How do you help commuters navigate traffic when only 19% of the population owns a smartphone? IBM's Nairobi Labs has released a solution for commuters that uses low resolution traffic cameras to predict traffic patterns that are relayed via SMS.
Relative Direction Versus Compass Direction
Learn about the difference between relative directions and compass directions.
QGIS versus ArcGIS
When considering which GIS desktop software to adopt, two of the most popular choices are Esri’s ArcGIS and Quantum GIS, ...
Megacity
A megacity in geography is an urban area that contains more than 10 million residents.

Using Citizens to Map Atmospheric Particulates
By leveraging data from over 8,000 smartphone users, Dutch researchers successfully mapped atmospheric particulate levels.

Mapping Almost 250 Years of Buildings in Manhattan
Morphocode‘s Urban Layers allows users to drill down and view the history of Manhattan’s buildings by mapping out over 45,000 ...

Smart Tree Logging with Remote Sensing
Treemetrics is using satellite imagery, UAV, and LiDAR to help forestry managers to map out forests in order to better assess the quality and value of their forests and to cut down on waste.

StateFace
Here’s a font collection cartographers and those in GIS might want to download for future use. StateFace is a sets ...

LANDCARPET: Turning Satellite Imagery into Carpets
This Austrian architect who now lives in Beijing, China has turned his love of the view from above into carpeting made from 100% New Zealand wool.

Searchable Database of Coordinate Systems
If you need a consolidated place to search for coordinate systems, EPSG.io is a place to start.

Optimizing Taxi Rides with HubCab
A project from MIT called HubCab analyzing 170 million taxi rides has found that sharing rides would reduce trips by 40%.

How the Ebola Outbreak has Highlighted Ignorance of Africa’s Geography
Despite the Ebola outbreak currently only affecting three countries that together make up less than 2% of the total area of Africa, the perception among some is that the entire continent of Africa is currently at risk.

Lake Extremes
What are the world's largest freshwater lake, the world’s largest saltwater lake, the world’s deepest freshwater lake, the highest navigable lake, and the saltiest lake?

OWGIS – Open Source GIS Web Application
Standing for Open WebGIS, the developers of OWGIS describe it as an “OpenSource Java Servlets web application that creates WebGIS sites ...

Land Cover GIS Data from the European Space Agency
The European Space Agency has released land cover maps covering the 2000, 2005, and 2010 epochs. Developed by ESA’s Climate Change Initiative ...