
GIS and Geospatial Technologies
Articles focusing on the application of geographic information systems (GIS), geospatial technologies, remote sensing, LiDAR, and Global Positioning System (GPS). These technologies serve as critical tools for understanding and interacting with our physical environment. GIS allows for the mapping and analysis of spatial data Geospatial technologies refer to the various tools used to measure and analyze Earth’s lands and resources. Remote sensing provides a way to collect data from a distance, often via satellites or high-flying aircraft, and is commonly used for environmental monitoring and military applications.
GIS subcategories :
GIS Career | GIS Data | GIS Industry | GIS Learning | GIS Software | GPS | Remote Sensing | Spatial Analysis

GIS and SQL
One way to leverage the power of GIS as a data service and analytical tool is to better integrate relational database capabilities.

Mapping Crops: Filling in Data Gaps with Landsat Archives
A recent study analyzed twenty years of Landsat data to look at corn and soybean crops across the US Midwest from 1998-2018.

Using Spatial Methods to Combat Gerrymandering After the 2020 US Census
The challenge for GIS is to create methods that can better determine what less biased district maps look like that are acceptable to the judiciary.

The Important of Mapping Trees for Wildfire Management
The California Forest Observatory, created by Salo Sciences, has applied a new artificial intelligence tool that maps every tree in California.

Self-employment in GIS
Self-employment in the GIS industry may seem daunting, but a recent MapScaping podcast with Kurt Menke, founder of Birds Eye View GIS, discusses how to build your own business.

Survey of GIS Professionals
A quick look at GIS professionals, their educational background, and the software tools and programming languages they use in their jobs.

Using GIS to Monitor the West Coast Wildfires
With fires raging in California, Oregon, and Washington, scientists, activists, geospatial companies, and others are using GIS and spatial data to better inform and protect communities.

How to View Animated Satellite Imagery of the California Wildfires
Users can quickly make animations of the California wildfires using imagery from NOAA's GOES-West satellite.

Earthquake Detection Using Smartphones
Using aggregated accelerometer data across many smartphones, many of us can now better access a large-scale earthquake warning system.
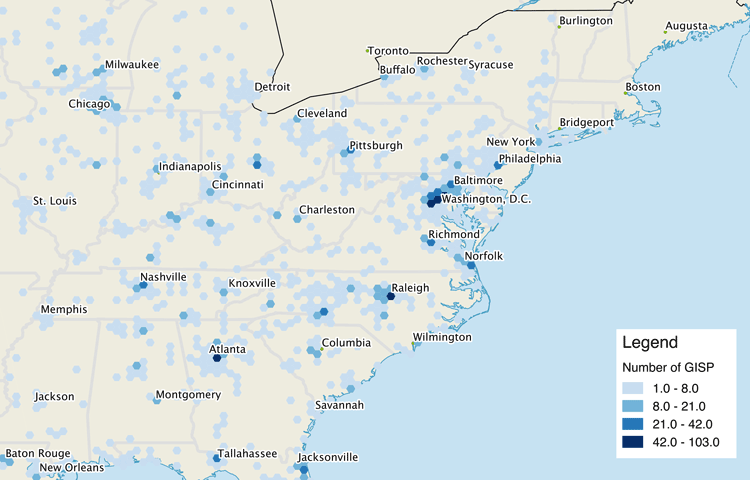
A Look at Where the GISPs Are
A recently published study took at look at the geographic, gender, and career characteristics of those that are certified Geographic Information Systems (GIS) Professional (GISP).
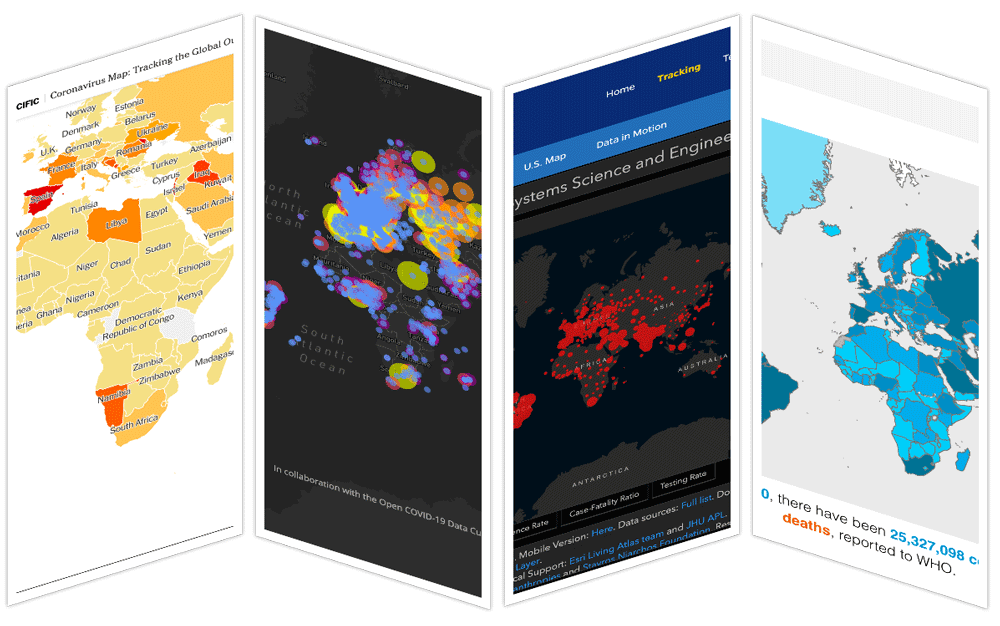
Online COVID-19 Maps and the ‘Infodemic’
Researchers have been evaluating the effectiveness and accuracy of online CoVID-19 maps.

Using Open Source Geospatial Tools to Find Missing Building Footprints
Researchers have developed a methodology that uses remote sensing measurements to predict completeness in coverage of building footprints in OpenStreetMap data.

Mapping Tropical Forest Quality from Satellite Data
Researchers have created high resolution maps of tropical forest quality using remotely sensed data from NASA satellites.

The Spatial Internet of Things
The development of small sensors is providing a variety of real-time geospatial data.

Find Open Sources of Elevation Data With OpenTopography
OpenTopography is a portal that provides access to open sources of topographical datasets and processing tools.

Self-Guided QGIS Courses
These six QGIS courses are available for free self-guided learning.

GIS: Thinking Beyond the Map
Now more than ever, GIS data is being used among a diverse set of industries and users.

Improving Urban Decision Making with Open Earth Observations
Steven Ramage, Head of External Relations, Group on Earth Observations (GEO), outlines innovative partnerships and activities GEO has been working on globally using open Earth data, GIS, and cloud technologies.

Magnetometers and Navigation
A new form of magnet being developed is aiming to make magnetometers not only provide direction of travel but also precise location information.

Open Geospatial Data and COVID-19
Some of the key GIS datasets being used today for research and outreach related to COVID-19 are assessed and reviewed.

Mapping Urban Heat
Lead by Portland State University professor Vivek Shandas, a network of citizen volunteers and local organizations are mapping urban heat islands in more detail than ever before.

Recent Developments in Remote Sensing and Earth Observation
Remote sensing and earth observation capabilities at satellite, aerial, UAV, and ground levels have radically improved in the last decade.

Esri Debuts New GIS Tools and Apps at the 2020 Annual User Conference
The first two plenary sessions contained a lot of demonstrations by Esri staff featuring the new GIS tools and applications launching this year.

How Geospatial Technologies are Helping to Complete the Effort to Map the World’s Ocean Floor
Only 20% of the ocean's floor has been mapping in detail.

GIS and the Future of Public Health
Mark Altaweel takes a look at how GIS is used in public health and where GIS and public health will be in the future.

QGIS and Free Mobile Applications
The capabilities of QGIS can be extended with plugins and mobile GIS apps.