
Articles

2019 Was a Tumultuous Fire Season in the Amazon
Scientists and researchers have pieced together the many impacts the 2019 Amazon fire season had on that region and the world as a whole.

Marketing and Rebranding GIS: Opportunities for GIS Professionals
GIS professionals need to emphasize more than just their geospatial skills when marketing GIS to organizations.

Coastal Ice Loss is Outpacing Mainland Ice Gains on Both Antarctica and Greenland
A recent study has confirmed that the coastal ice loss is much greater than the mainland ice gain on both Antarctica and Greenland.

Testing Sewage Can Predict COVID-19 Spikes
The concentration of coronavirus RNA in sewage could point researchers toward a clearer picture of how many residents have been infected by the virus in a specific area.

Easily Create Interactive Flow Maps
Ilya Boyandin has developed an easy-to-use online tool that takes location data stored in Google Sheets to visualize interactive flow maps.

Python and Geospatial Analysis
Two recent podcasts from MapScaping take a look at the use of Python in geospatial analysis.

Time-lapse Photo of the International Space Station Passing in Front of the Sun
NASA photographer Joel Kowsky was able to capture this time-lapse photograph of the International Space Station (ISS) as it passed between the Earth and the Sun.

Find Your Way Downstream with Streamer
Water is essential for life on the planet, and tool from the U.S. Geological Survey (USGS) makes it easy and fun ...

The Earth Archive Project and 3D Mapping the Earth
The Earth Archive Project, launched in 2019, is a project that will provide a detailed 3D map of the entire Earth.

What is the Largest Island in the Pacific Ocean?
New Guinea is the largest island in the Pacific Ocean.

Crown Shyness: When Trees Need Personal Space
Crown shyness is a phenomenon where the outstretched branches of one tree don't touch neighboring tree branches.

Mapping the Impact of Human Activity
Different methods have been utilized by landscape ecologists to map and study the Earth’s relationship to human activity.

Rebounding Pollution Levels Mark End of Coronavirus Lockdowns
As countries reopen during the COVID-19 pandemic, an increase in pollution has been detected by NASA and European satellites.

Study Estimates That 3 Billion People Will Be Living In Extreme Heat By 2070
Researchers used data from UN population projections to map out how a three-degree warming scenario will translate into temperature changes for the world's population.
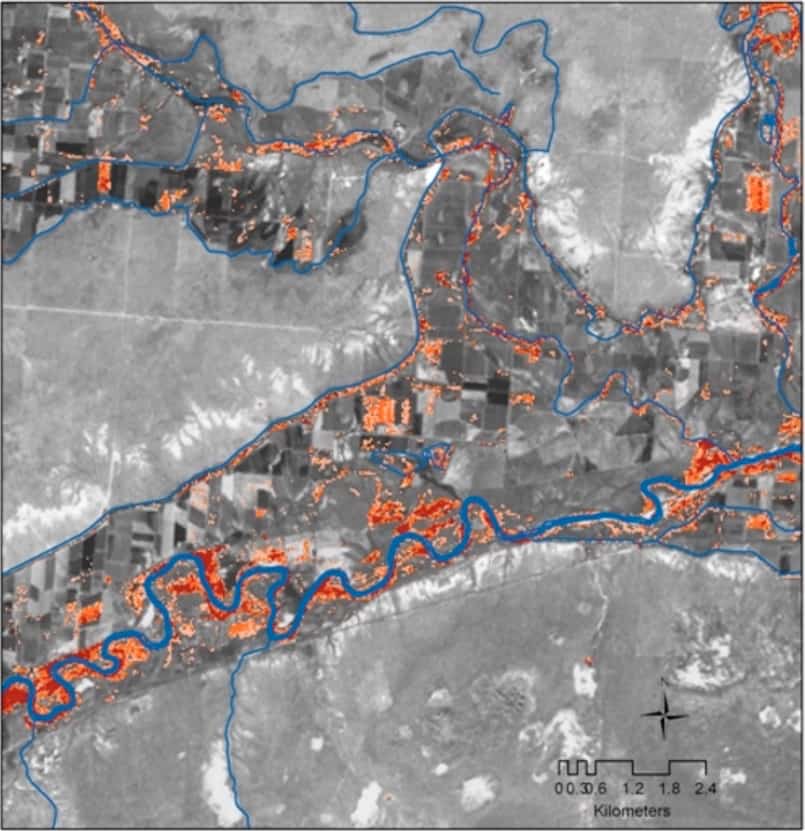
Using Remote Sensing to Map Invasive Species
Scientists and researchers are increasingly using remote sensing methods to map and track invasive species.

Spread of Coronavirus May Have Seismic Implications
Scientists who record and observe seismic activity around the globe are detecting major decreases in activity as the effects of the Coronavirus continue.

Monitoring Volcanoes Using UAVs
With the increase usage of unmanned aerial vehicles (UAVs), or drones, scientists now have a powerful tool to map active volcanoes safely.

ESA Launches Global Air Pollution Map
The European Space Agency offers an online map that shows global air pollution data collected from its Copernicus Sentinel-5P satellite.

The Geography of Early Christian Ireland and England
For nearly four centuries, Britain was Roman Britannia. This period of imperial rule was a largely peaceful and prosperous time. It was also ...

Using Drones to More Accurately Count Sea Turtles
Researchers have found that using drones and underwater cameras is a quicker and more accurate way to count green turtles.

Analysis of Satellite Imagery and Search Data Suggests the Coronavirus Outbreak May Have Started Earlier in 2019
A study that analyzed traffic around hospitals using satellite imagery and Baidu search queries suggests that the coronavirus outbreak may have started earlier in China than in December of 2019.

Massive List of GIS Tasks and Job Titles
Ever wonder how diverse the titles are of those that work with GIS?

What is Continuous Versus Discrete Data in GIS?
All datasets in GIS can be categorized as being either discrete or continuous.

What is Cadastral GIS Data?
Cadastral GIS data is data that contains information about land ownership. Parcel datasets are one form of cadastral GIS data. ...

Earth’s Largest Shield Volcano
Scientists have discovered the Earth's largest volcano using bathymetric and gravity mapping.
