
Articles

Making Joy Plots with GIS
Joy plots is a cartographically creative way to show topography on a map. Learn how to create joy plots using GIS.

Review | Extinctions: Living and Dying in the Margin of Error
This book sets out, in some nine chapters, both the ‘turbulent’ journey of that one species living 3.7 billion years ago to the 8.7 million today and the human activity threatening that biodiversity.

Enhance Your GIS Opportunities in Africa
Olufemi Damilola from Africa GeoConvo Podcast discusses information about employment options as a GIS enthusiast or student, as well as a curated list of African organizations that employ GIS practitioners.

53% of U.S. Ocean, Coastal, and Great Lakes Waters are Unmapped
According to a new report by the United States' federal Interagency Working Group on Ocean Coastal Mapping, 53 percent of the country's ocean, coastal, and Great Lakes water is still unmapped.

Geology Quick Facts for Each U.S. State
Listed here are the official state rock, gemstone, mineral, and fossil for each U.S. State.

How the Satellite Imagery Industry is Re-inventing Itself
Joe Morrison discusses how new businesses are developing tools that use satellite imagery and SAR to quantify climate-related disasters.

How Did Ida Turn Into Such a Strong Hurricane?
Oceanographer Nick Shay explains how eddies, part of what’s known as the Loop Current, help storms rapidly intensify into monster hurricanes.
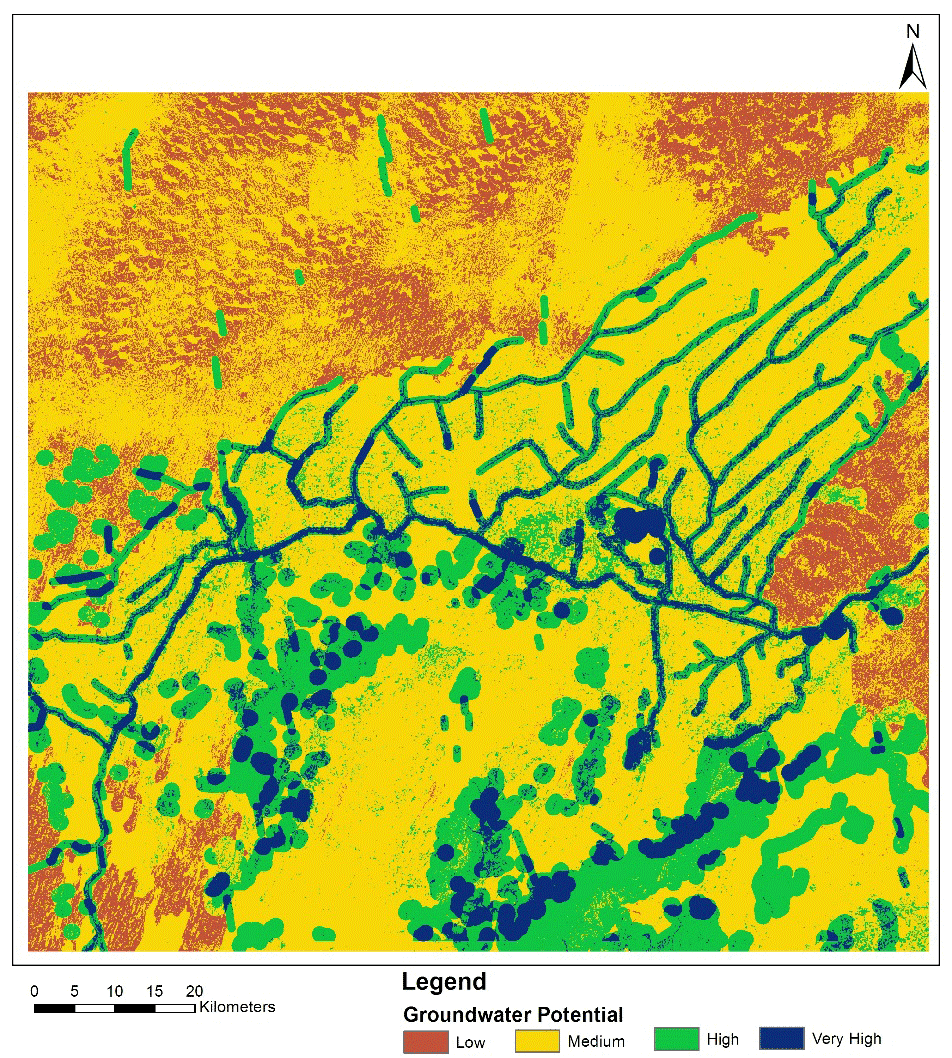
Mapping Groundwater Potential in a Desert using Geospatial Technology
Anindita Ghosh discusses her study that used GIS tools and analysis to map out areas with groundwater potential in a desert.
4 Things to Learn About Hurricane Ida
These four resources explain why the New Orleans area is at high risk for severe hurricanes and what role climate change plays in these devastating storms.

Introduction to Wildlife Corridors
Wildlife corridors are overpasses and underpasses that connect natural regions and provide safe transit for migratory animals through human infrastructure.

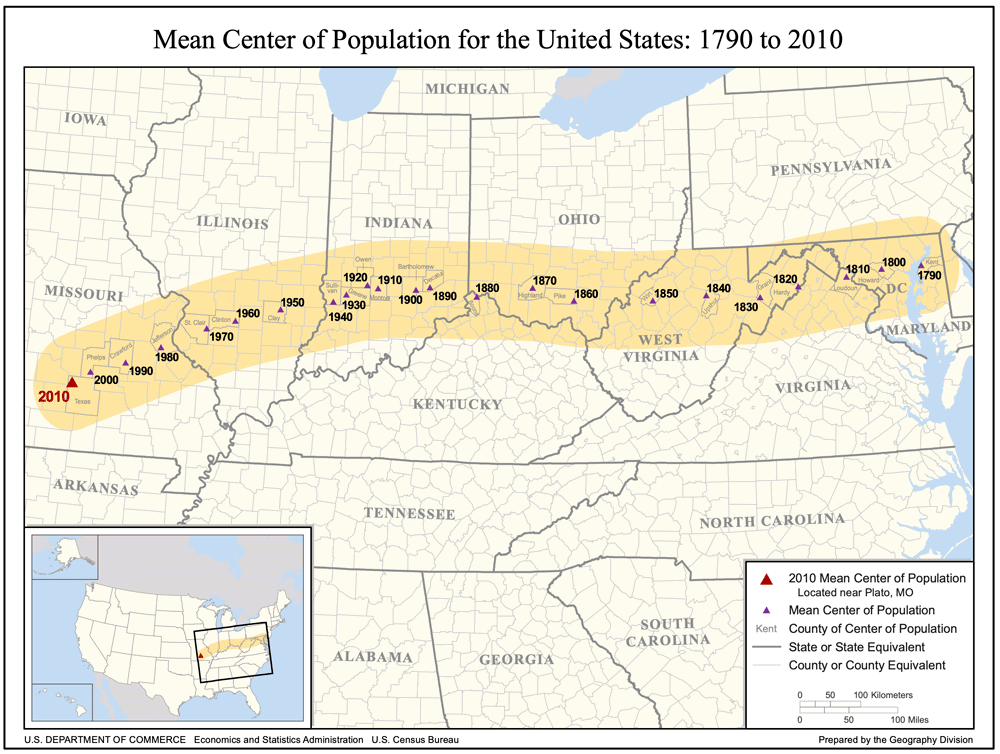
Population Geography of the United States
The United States represents a vast area of land with 3.79 million square miles (9.83 million square kilometers) in size. A ...
![[Map of California shown as an island], Joan Vinckeboon, ca. 1650.](https://www.geographyrealm.com/wp-content/uploads/2021/08/map-california-island-1650-Vinckeboons.jpg)
California as an Island
Well into the 17th and 18th centuries, cartographers created maps of the region showing California separated from the mainland by a strait.

These Clouds Only Predictably Form in Australia
Morning Glory clouds are a unique and rare cloud formation only predictably seen in the Gulf of Carpentaria in Australia during spring.
Calculating Land Use Mix with GIS
Alexandros Voukenas explains how to calculate land use mix indices (such as entropy) in a GIS environment.

The Growth of Crows in Cities
Since the 1960s, more and more crows have been abandoning their rural winter roosts in favor of cities and towns.
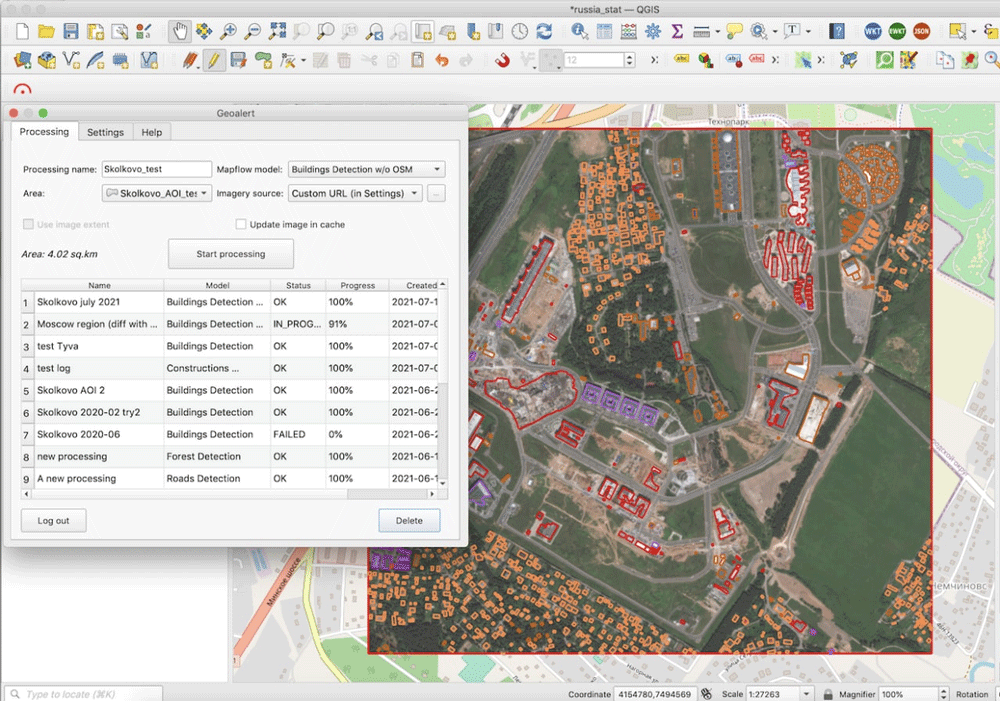
Run AI-Mapping in QGIS over high-resolution satellite imagery
Mapflow is a QGIS plugin that lets users extract real-world objects from satellite imagery.

Review | Drought, Flood, Fire: How Climate Change Contributes to Catastrophes
"Drought, Flood, Fire: How Climate Change Contributes to Catastrophes" is written by a scientist who understands how to meaningfully inform his non-scientist readers.

Kleptotrichy: Birds Who Steal Fur
Scientists recently released their findings on why birds pull fur from animals, which is a potentially risky behavior.

How to Use ArcGIS Pro to Map Flood Susceptibility
This tutorial makes use of spatial data science and remote sensing techniques to assess the susceptibility of floods using ArcGIS Pro.
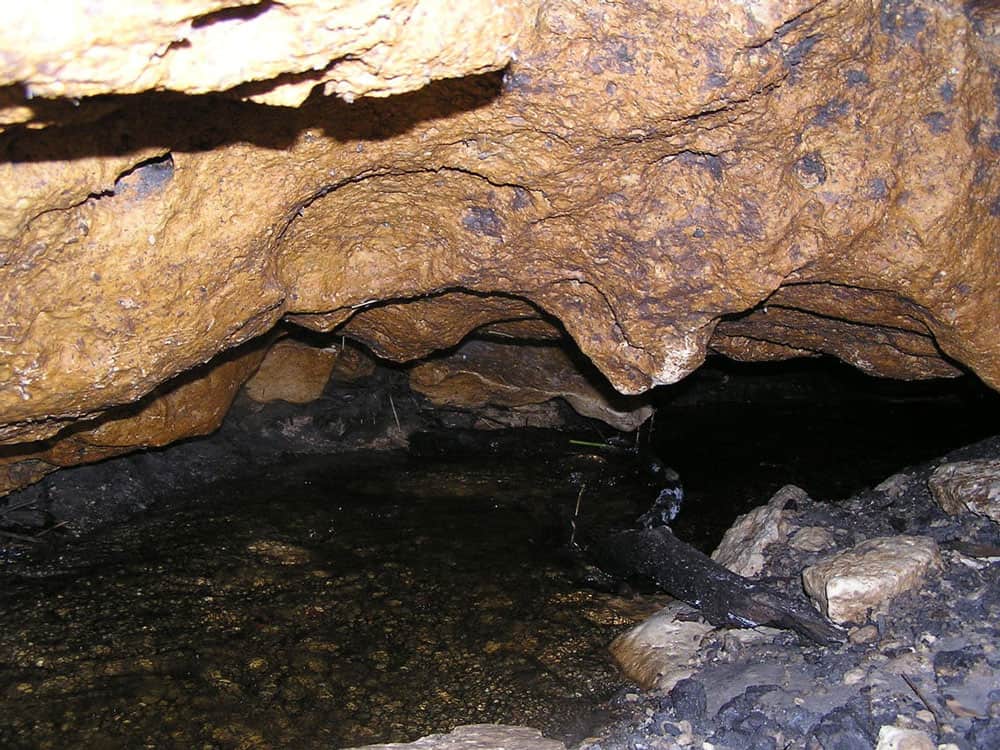
Mapping Underground Features
In recent decades, mapping underground features, such as physical structures or even sounds, has substantially improved.

2021 Wildfires in the U.S. and Canada
Climate change is causing wildfires to burn longer and more frequently in some northern latitudes.

North American Monsoon
The North American Monsoon is a pattern of increased rainfall that occurs across much of the southwestern USA and northern Mexico, often commencing in July and ending in September.

Geography of American Bison
Learn about the American Bison, which once roamed North America in large herds.

GIS and Rewilding Efforts
GIS and geographical techniques help identify the best locations for successful rewilding and improve decisions on what to rewild.

States in Order of Admission to the United States of America
Learn the order in which each state was admitted to the United States as well as some geography facts.