
Articles

Mapping Plant Stress With Remote Sensing
NASA researchers are able to map out plant stress using a remote sensing from ECOsystems Spaceborne Thermal Radiometer Experiment on Space Station, or ECOSTRESS.

Lowest Natural Point in Japan
At 4 m (13 ft), Lake Hachirō in Akita Prefecture in northern Japan is the lowest natural point in Japan.

Map of Geospatial Companies Around the World
Christoph Rieke has assembled a growing list of commercial geospatial companies with offices located all around the world.

Where Does the Earth Store All Its Carbon?
It is estimated that 1.845 billion billion metric tons of carbon are settled in mantle and crust, while only 43,500 billion tons can be found on the surface.

Geospatial Data Available: Global Sea-surface Salinity
Data from three satellite missions has been merged to produce a global time-series showing sea-surface salinity measurements between 2010 and 2018.

Learn How GIS and Earth Observation Can be Used to Support the United Nations Sustainable Development Goals
Earth Observation and GIS technologies have a huge impact on both monitoring the implementation of the United Nation's sustainable development goals.

Looking at Centuries of California’s Climate to Understand Fire Risk
Researchers examined moisture patterns and atmospheric wind conditions in California using climate models and centuries of paleoclimate data (from 1571 to 2013).

South Atlantic Humpback Whale Population Rebounds from Near-Extinction
Recent research and updated methods of counting and tracking whale populations has shown an increase in humpback numbers located in the South Atlantic.

Creating a Spatial View of the Brain
Mapping small scale but complex organs such as the human brain is requiring new technologies and spatial modeling to be developed.

Thanksgiving Maps and Geography
Thanksgiving maps about this holiday involving major feasting. Maps shown include distribution of turkey, green beans, sweet potatoes, and cranberries by Zellmer and a similar interactive map by Esri.

24 Days of QGIS Tips
Using the #24daysofqgis hashtag, North Road, a geospatial company based out of Australia, will be tweeting out a QGIS tip or trick for 24 days starting on December 1.
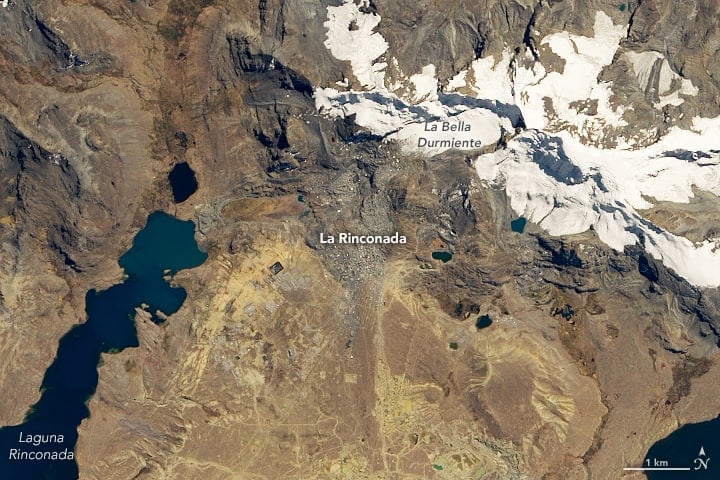
Highest Permanent Settlement in the World
Located at 5,000 meters (3 miles) above sea level, La Rinconada in southeastern Peru is the highest permanent settlement in the world.

Arctic Permafrost is Now Releasing More Carbon Than it Stores
The researchers found that the Arctic region has transitioned from a carbon sink to a source of carbon emissions.
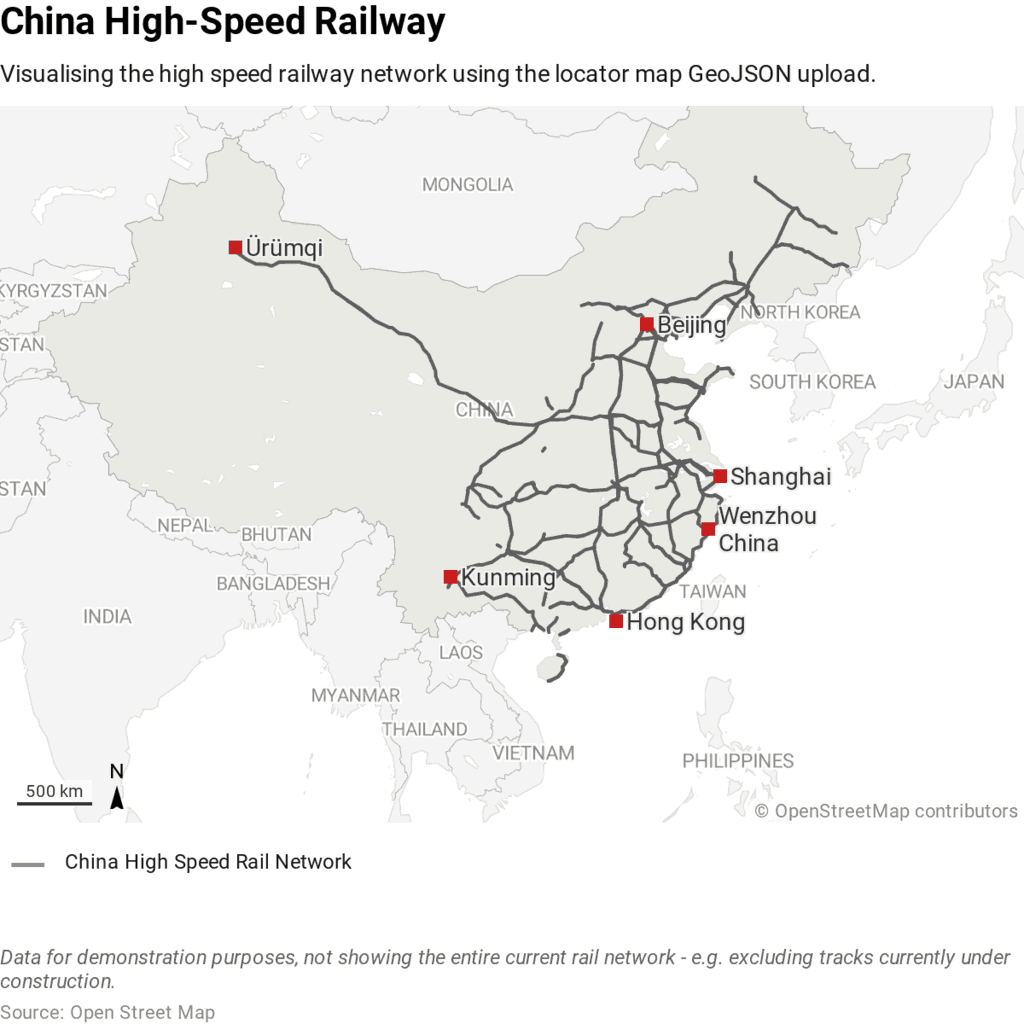
Which Country Has the Most High Speed Rail Lines?
While China only started developed its HSR network in 2003, it has quickly become the country with the most high speed rail lines.

Artificial Intelligence Was Used to Discover a New Nasca Line
Researchers tested out the use of artificial intelligence to assist with finding new Nasca lines.
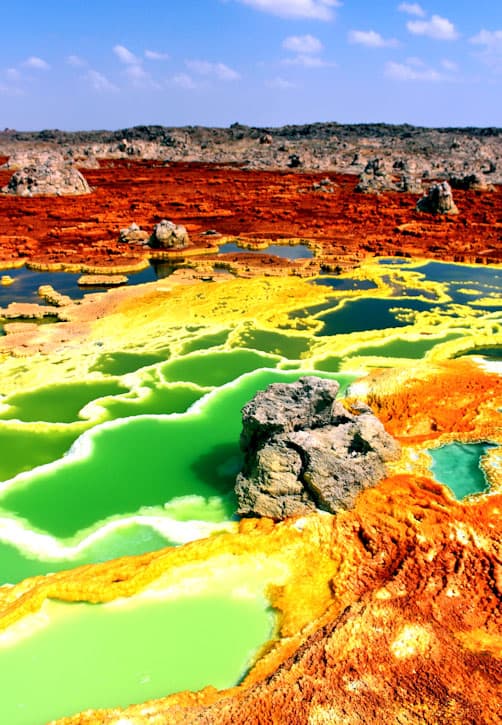
A Place on Earth Where No Life Exists
Researchers recently discovered at least one location on Earth that lacks any discernible life forms.

How New York City is Protecting Its Subway System Against Flooding
A flex-gate is a highly flexible covering that can be quickly deployed to protect a subway's entrance and underground structures in the event of a flood.

View From Space: Australia’s Wildfires
The Moderate Resolution Imaging Spectroradiometer (MODIS) on NASA’s Aqua satellite acquired a natural-color image acquired this image of smoke rising from wildfires burning in New South Wales (NSW) and Queensland.

Understanding LiDAR Technologies
This article presents insights from the new IDTechEx report titled “Lidar 2020-2030” IDTechEx report.

Small-scale Deforestation is on the Rise in the Amazon
Researchers analyzed forest loss rates across the entire Amazon between 2001 and 2014.

I’m a…. the GIS Profession in One Word
How do you describe GIS as a profession in as few words as possible?
DNA Science and GIS
In recent years, spatial analysis has supplemented our understanding of genetic variation and DNA studies.

How Ice Balls Form
When conditions are just right, a strange phenomenon called ice balls or ice eggs can form along beaches during the winter months.

The Critical Role of GIS in NG9-1-1
Drew Fioranelli, GISP, Public Safety GIS Market Maker, and Annie Cahill, Public Safety GIS Technical Manager with DATAMARK, discuss the history of 9-1-1 infrastructure as well as the foundational role of GIS and GIS professionals in the transition to Next Generation 9-1-1 (NG9-1-1) .
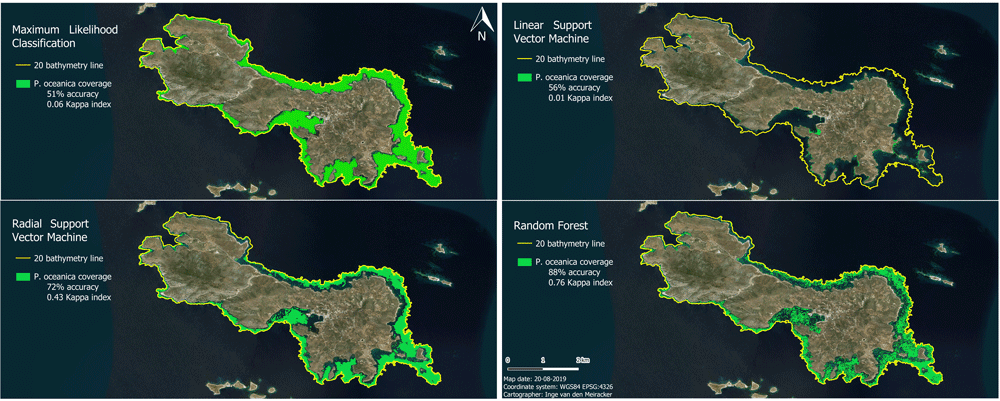
Mapping the Subsea Forests of the Mediterranean
Inge van den Meiracker writes about her research internship in Greece where she modeled and mapped the seagrass distribution in the Southeast Aegean Sea using sonar data, remote sensing techniques, and GIS.

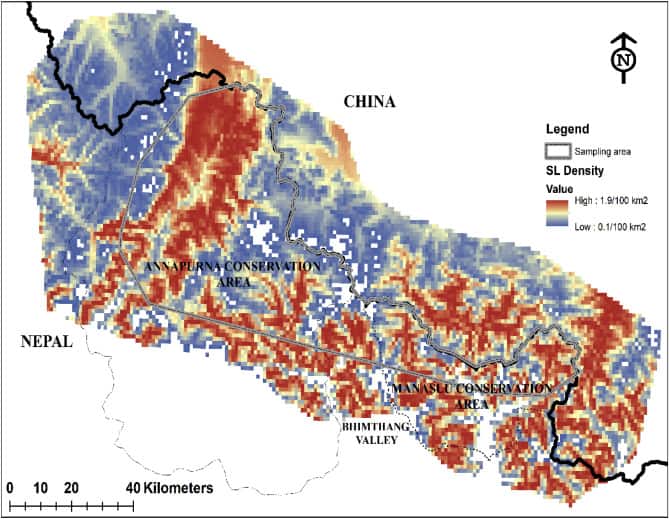
How Refugia Will Protect Some Animals and Plants from Climate Change
Scientists and conservationists are working to find refuge areas in order to further land management plans and climate change predictions.