
Articles

Review | The Longest Line on the Map
This book tells the story of how and why the Pan-American Highway was conceived and, poignantly, the why of a stubborn gap that remains unconnected.

Measuring the Neutrino Tomography of Earth
In November of 2018, an international team of physicists managed to measure Earth’s mass by using neutrino tomography and the data captured by the South Pole’s IceCube Neutrino Observatory.
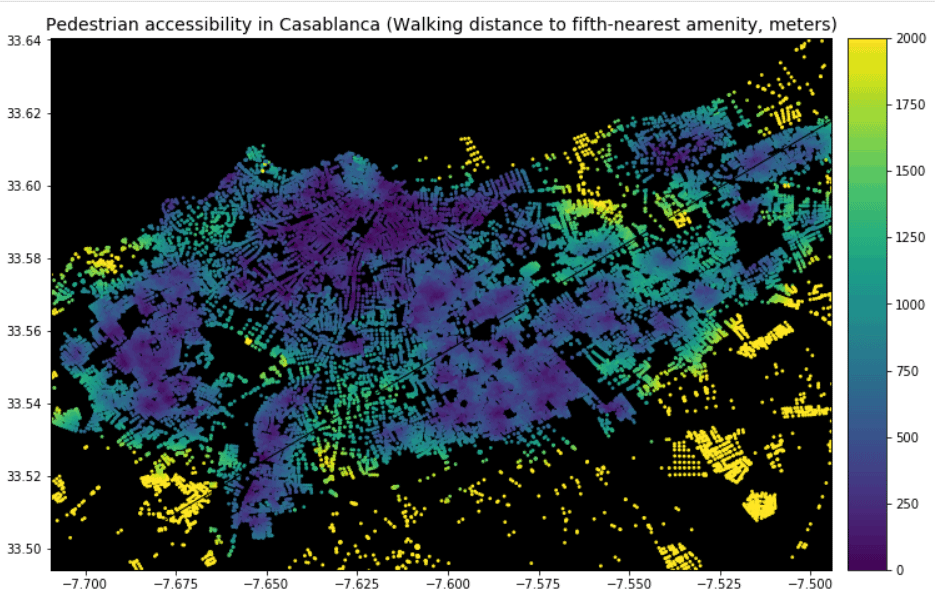
Using GIS to Analyze Pedestrian Accessibility
GIS tools to compute pedestrian accessibility are not just available to governments, academics, or companies, but are also free and open source.

Before There Were Drones: Using Pigeons for Aerial Photography
Back before drones became a cheap and easy way to acquire aerial imagery, a German inventor proposed using pigeons to capture photographs of the earth from above.
GIS From the Past: CARETS
In the early 1970s, a joint pilot project between NASA and the USGS sought to test out the feasibility of integrating data from Landsat and high-altitude aircraft sensors into a regional land use database.

Who Coined the Term ‘Remote Sensing’?
While the origins of remote sensing can be traced to World War II's use of radar, sonar, and thermal detection technologies, the use of the term 'remote sensing' wasn't coined until the late 1950s.
Geospatial Climate Models Show How Fire Seasons Are Changing
Changing technologies, including new satellite systems, and better climate and fire modeling, including the integration of these tools and data capture methods, will likely mean improved fire modeling in the future.

What is Negative Rainfall?
Negative rain(fall) occurs when a particular area experiences more atmospheric evaporation than water downpour over a period of time.

Defining Biogeographic Regions
A recent paper published in Applied Geography explored ways to improve the determination of biogeographic regions using clustering techniques.

Antarctica is Losing Ice Six Times Faster Than 40 Years Ago
Researchers analyzed ice mass between 1979 and 2017 in Antarctica and found a sixfold increase in yearly ice mass loss.

Atmospheric Rivers
Atmospheric Rivers are trails of moisture in the atmosphere composed of condensed water vapor.

Tracking the Carbon Cycle in North America: 2018 Report
In November 2018, the United States Carbon Cycle Science Program released a report, entitled Second State of the Carbon Cycle Report (SOCCR-2), about the nature of the carbon cycle in North America, covering Canada, the United States, and Mexico.

Tracking Ocean Currents With Seabirds
A group of researchers wanted to test if drifting seabirds could offer a novel way of collecting data about sea current velocity and direction.

What is the Oldest Surviving Aerial Photograph?
The oldest surviving aerial photograph was taken on October 13, 1860 by James Wallace Black over the city of Boston.

Ground Movement in Norway
Data from InSAR Norway has helped the Geological Survey of Norway learn where there are areas of significant ground movement in both natural and urban areas of Norway.

Mapping Where Norway is Moving
Norway is using Copernicus Sentinel-1 data to detect ground movement across the country.
Mapping Out Ammonia Hotspots With Satellite Data
Researchers recently used satellite data to create a high resolution map of ammonia hotspots around the world.

How Much of the Earth is Covered by Clouds?
Exactly how much of the world is covered in clouds?

Changes in Countries and Capital
Listed here are more recently formed countries and capitals that have moved and well as some geography news items about some countries.
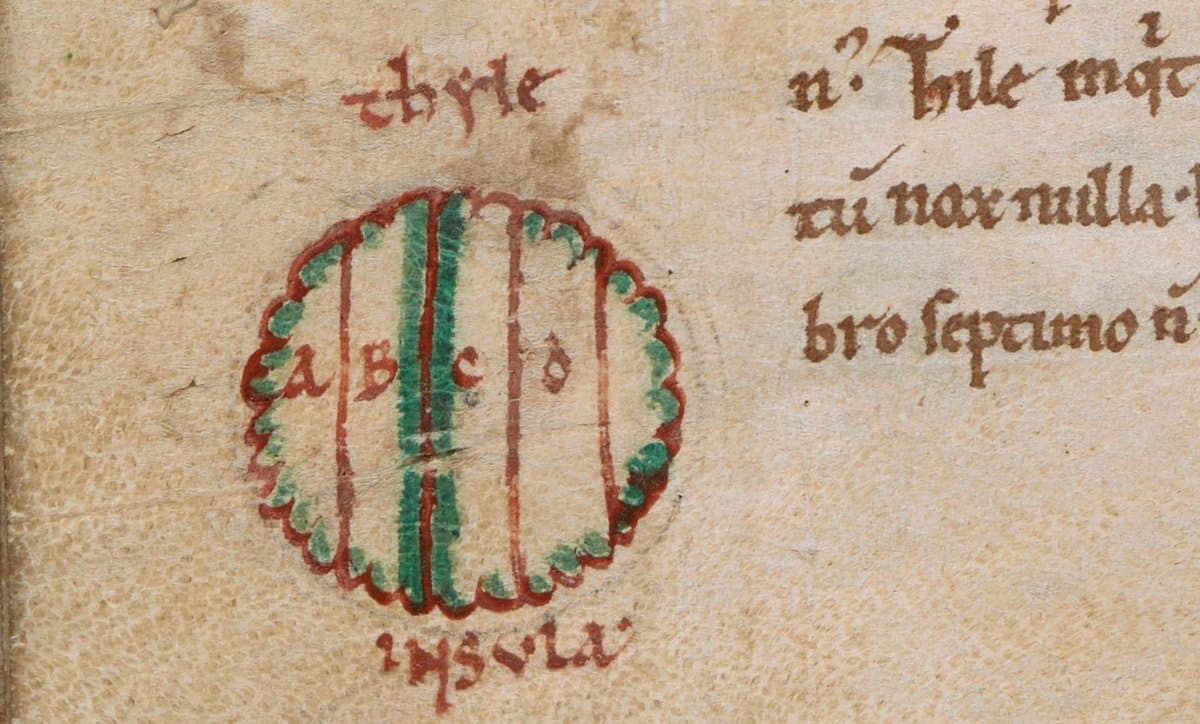
What Does Ultima Thule Mean?
Ultima thule is Latin and has been used over to the centuries to refer to an area of the world that is the most distant and inaccessible.

How To Use the Equal Earth Projection With QGIS on the Mac
Here are a few short steps to set up the Equal Earth map projection in QGIS.
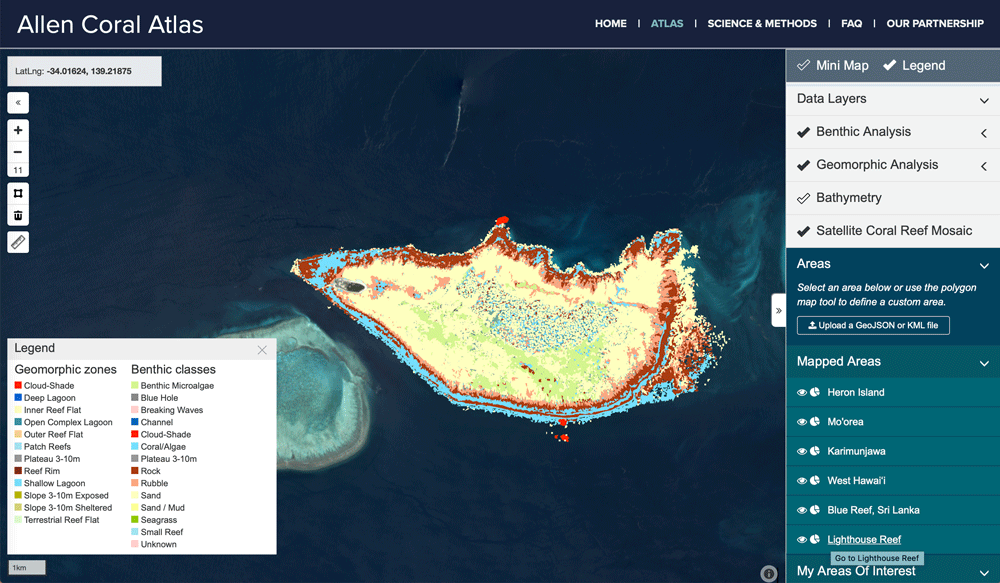
Mapping Coral Reefs
Scientists have been developing better ways to fuse data from different satellite systems and data capture, while also developing classification algorithms to better map coral reefs.

Hand Cut Paper Map of Amsterdam in the Shape of a Leaf
Street artist Nils Westergard created this intricate map of the streets of Amsterdam in the form of a leaf cut out from paper with an X-Acto knife.

PACE: NASA’s Earth Observation Satellite to Launch in 2022
NASA’s PACE (Plankton, Aerosol, Cloud, Ocean Ecosystem) is a planned earth observation satellite with an anticipated launch in 2022.
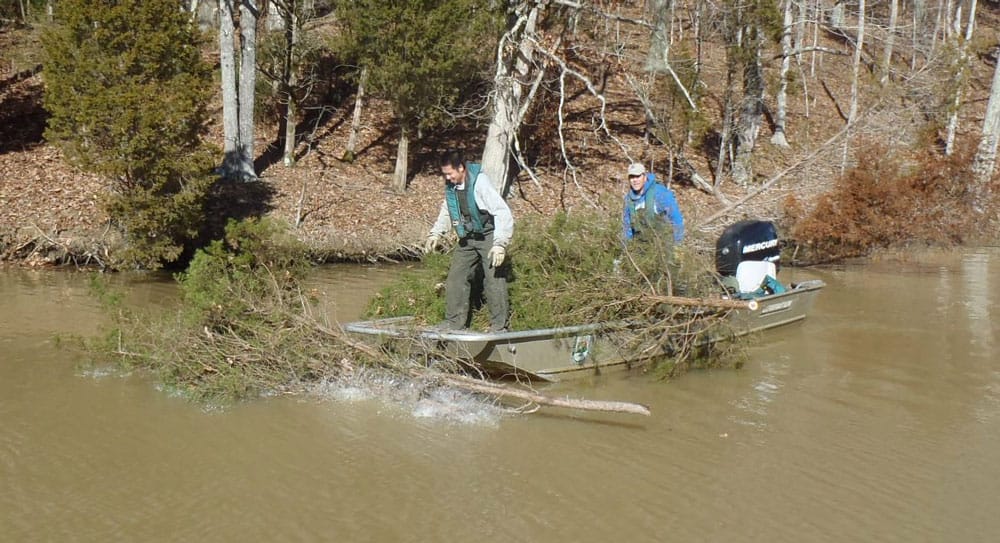
Using Christmas Trees for Habitat Restoration
Upcycling Christmas trees helps to restore fish habitat, restore sand dunes, and supports native marsh grass growth.

This Remote Island Has the Highest Density of Trash in the World
The remote island of Henderson Island is accumulating trash at a rate of 26.8 items per day. With over 671.6 items of debris per square meter along its beaches, this island has the highest density of trash in the world.