
GIS and Geospatial Technologies
Articles focusing on the application of geographic information systems (GIS), geospatial technologies, remote sensing, LiDAR, and Global Positioning System (GPS). These technologies serve as critical tools for understanding and interacting with our physical environment. GIS allows for the mapping and analysis of spatial data Geospatial technologies refer to the various tools used to measure and analyze Earth’s lands and resources. Remote sensing provides a way to collect data from a distance, often via satellites or high-flying aircraft, and is commonly used for environmental monitoring and military applications.
GIS subcategories :
GIS Career | GIS Data | GIS Industry | GIS Learning | GIS Software | GPS | Remote Sensing | Spatial Analysis

Open-Source Science in the Cloud Collaboration
NASA and the European Space Agency (ESA) released a new open source and science tool called the Multi-Mission Algorithm and Analysis Platform (MAAP).

Mapping Ocean Currents
Mapping ocean currents and understanding how they vary is critical for geographers and scientists, especially as our globe changes.
How to Create a Time-lapse of Satellite Imagery With Google Earth Engine and Streamlit
Qiusheng Wu explains how to make a 60-second satellite timelapse of any location on the globe.
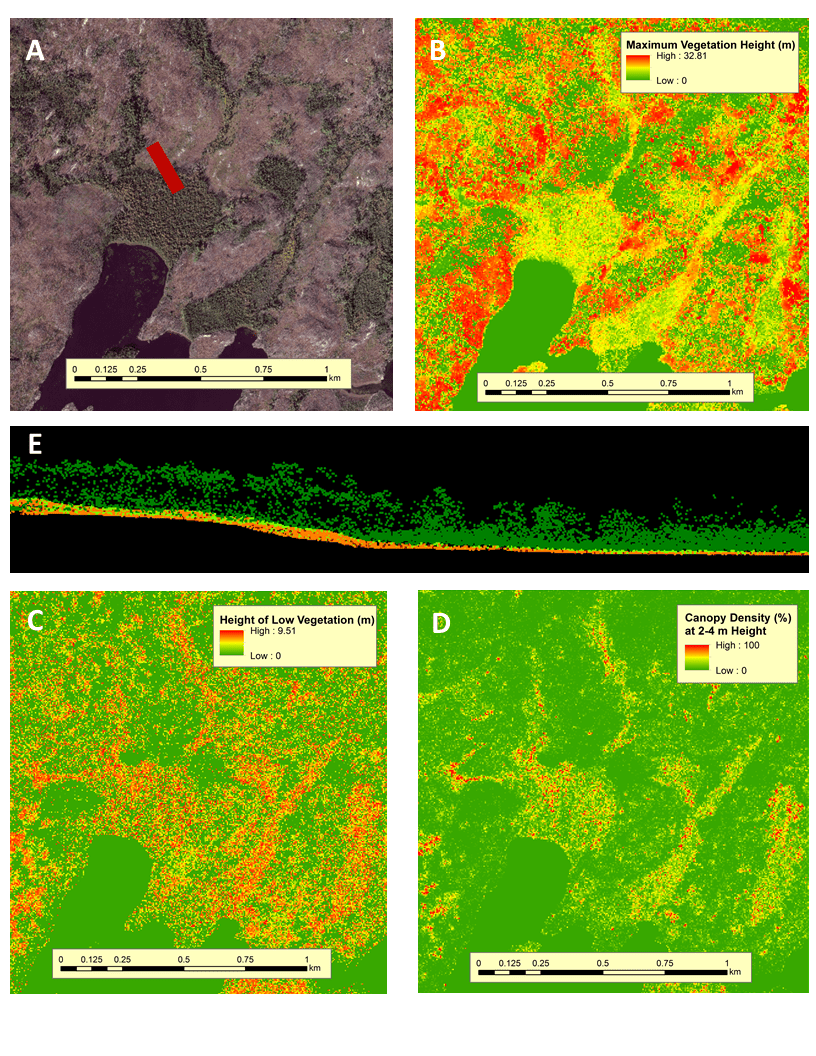
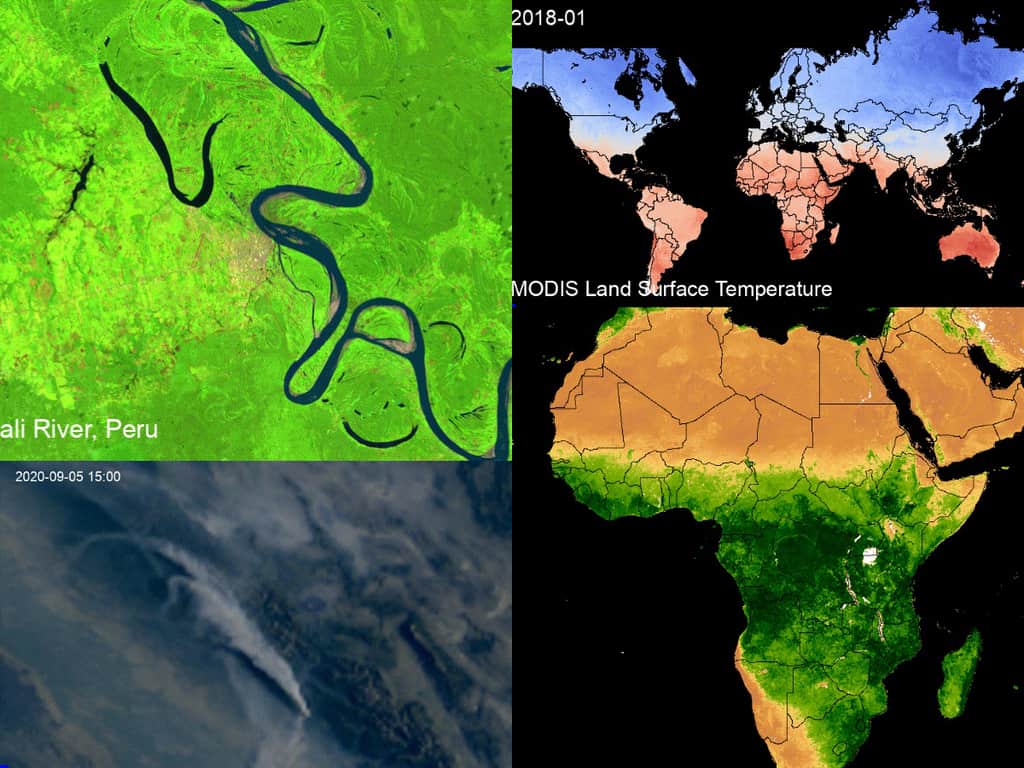
Mapping Ecosystem Health through Satellite Data
Remote sensing techniques, particularly those based on satellite, drone, and aircraft data, have revolutionized collecting ecosystem data.

Mapping the World’s Fungi
Scientists have created a collaborative effort, called the Society for the Protection of Underground Networks (SPUN), which aims to map and protect large areas of fungi.
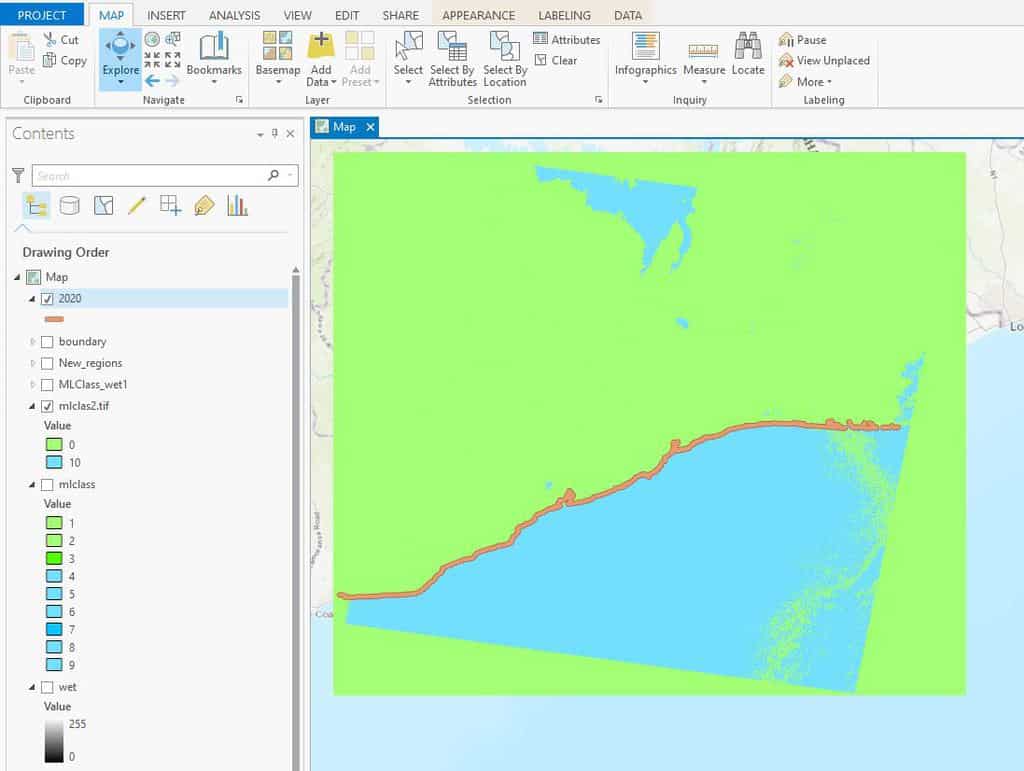
How to Use ArcGIS Pro for Automatic Shoreline Delineation from Landsat Imagery
Learn how to extract shorelines in ArcGIS Pro using the Tasseled Cap and NDVI indices with the Landsat toolkit for automatic shoreline delineation.
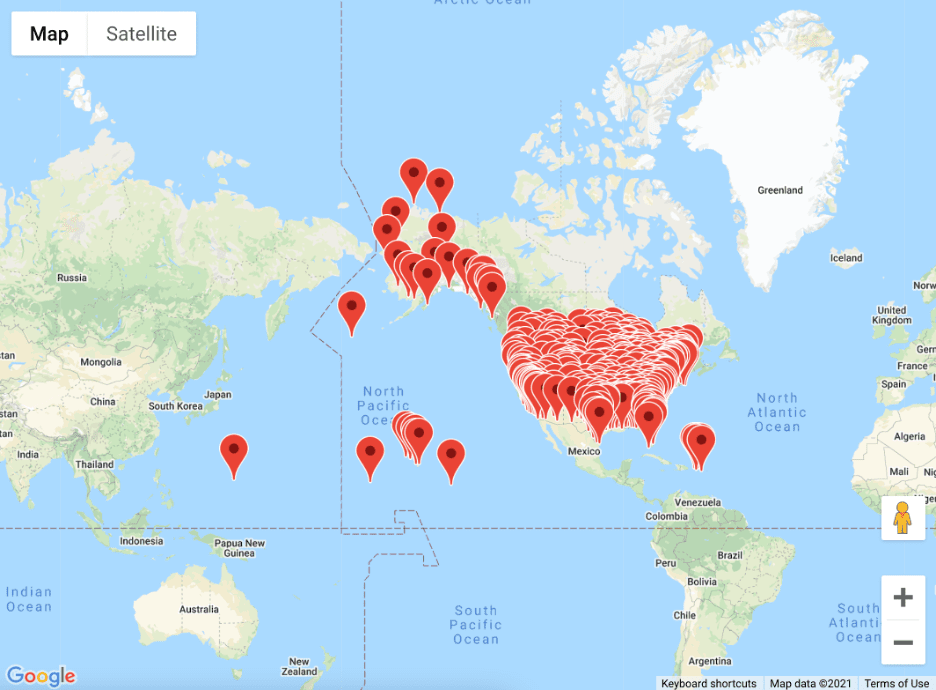
A Guide to Building Interactive Google Maps with R Shiny
Dario Radečić demonstrates how to build interactive Google Maps with R, and how to include them in R Shiny dashboards.

Mapping Natural Carbon Storage
Scientists have created a map of the Earth where carbon needs to be stored to keep climate goals from Cop26 possible.

World Flood Mapping Tool
The World Flood Mapping Tool, developed by the UN University's Institute of Water, Environment, and Health, aims to help countries with limited data construct flood maps.

You Are Here: How Google Improves Mobile Location Accuracy
Ed Parsons explains how Google continues to innovate in the location technology sector.

Six Things You Should be Doing to Enhance Your GIS Career
Here are six focus areas you should be working on to further your GIS career.

GIS Day and PostGIS Day Are Coming Up
November 18, 2020 marks the 21st anniversary of GIS Day. The following day is PostGIS Day.

How to Perform a Site Selection Analysis in ArcGIS Pro
Using this tutorial, ArcGIS Pro users will learn how to do a site selection analysis, which includes analyzing travel times and accessibility to a location via various modes of transportation.

Spatial Node: a Platform for Geospatial Professionals
Spatialnode is a platform for all things geospatial and earth observation including the people behind these technologies.

Remote Monitoring of Construction Using Geospatial Technologies
ConsTrack uses satellite imagery, remote sensing, and machine learning to monitor construction activities.

GIS, Spatial Data, and Agroforestry
Geopatial analysis and GIS are crucial tools for assessing the quality and types of landscapes suited for growing various types of vegetation.

Open Topography: A Spatial Data Infrastructure for Topographic Data
Open Topography is a web-based portal for imagery and lidar data that allows users to create their own deliverables.

How to Create Firefly Cartography with QGIS
Firefly cartography is a cartographic style used to create maps that glow. Learn how to make a firefly map using QGIS.
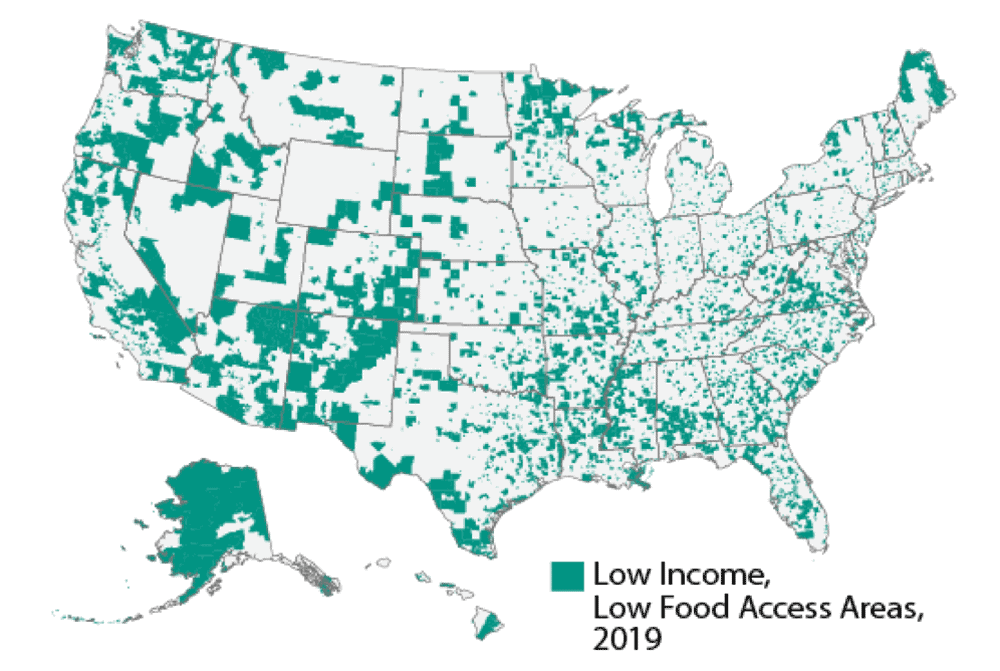
Using Local Knowledge to Better Map Food Deserts
Mapping and understanding food deserts is important if we are to understand how best to tackle the lack of healthy food options in the United States.

Mentoring in the Geospatial Industry
Opeyemi Kazeem-Jimoh of the Geospatially Africa Podcast spoke to Sharon Omoja, a regional ambassador for Women in Geospatial+ about her personal experience in volunteering and mentoring women in the geospatial industry.

Making Joy Plots with GIS
Joy plots is a cartographically creative way to show topography on a map. Learn how to create joy plots using GIS.
Enhance Your GIS Opportunities in Africa
Olufemi Damilola from Africa GeoConvo Podcast discusses information about employment options as a GIS enthusiast or student, as well as a curated list of African organizations that employ GIS practitioners.

How the Satellite Imagery Industry is Re-inventing Itself
Joe Morrison discusses how new businesses are developing tools that use satellite imagery and SAR to quantify climate-related disasters.
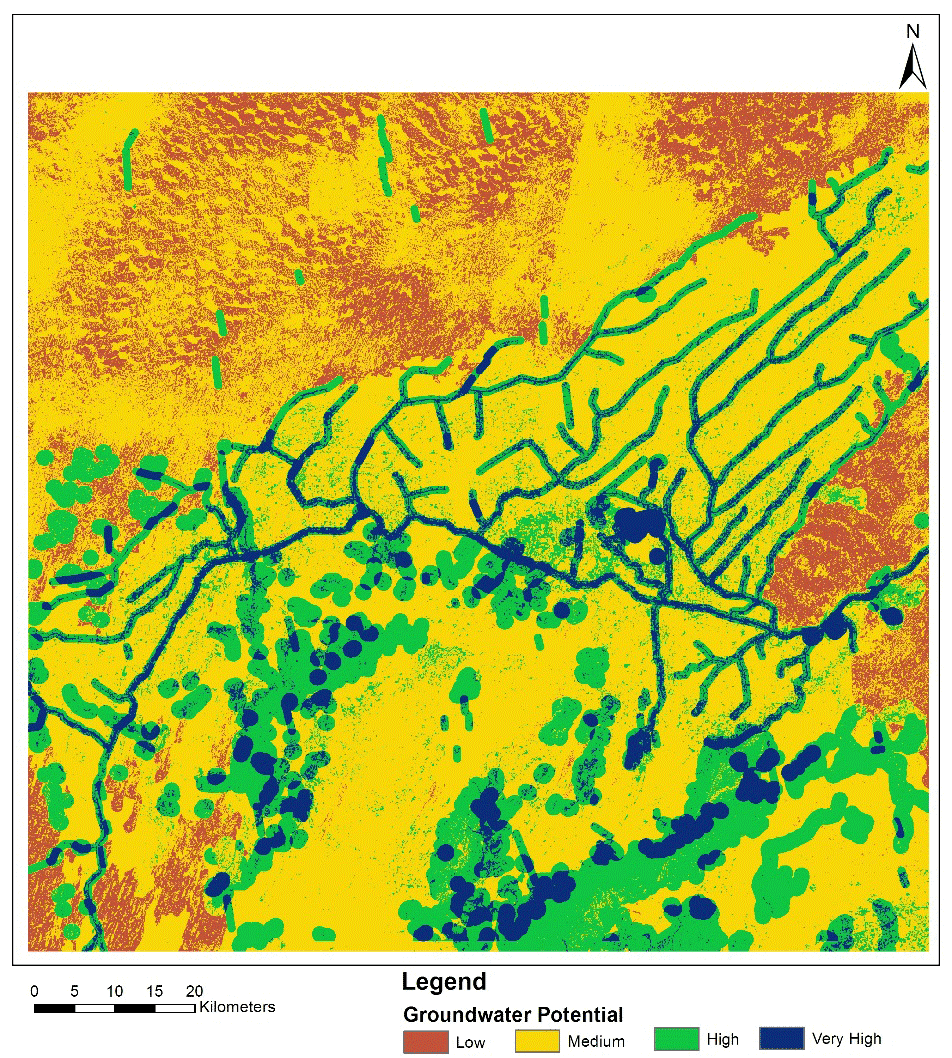
Mapping Groundwater Potential in a Desert using Geospatial Technology
Anindita Ghosh discusses her study that used GIS tools and analysis to map out areas with groundwater potential in a desert.
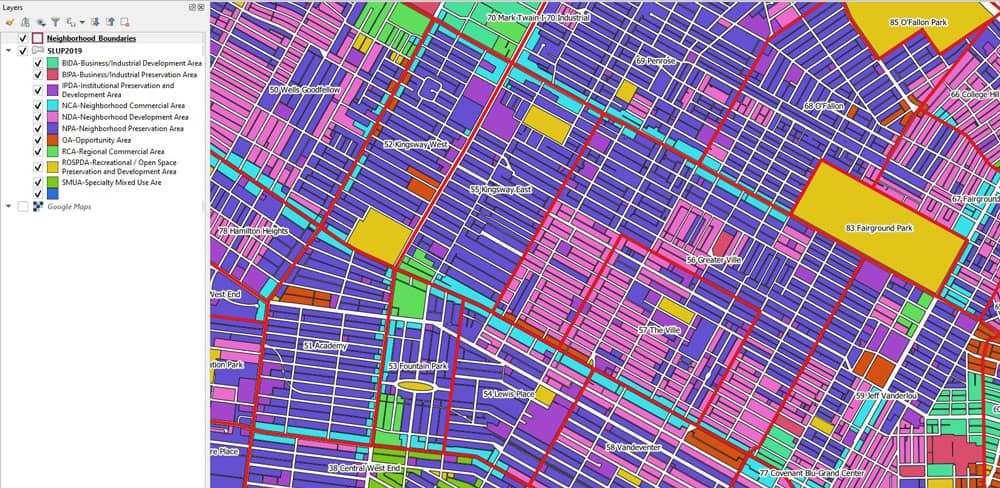
Calculating Land Use Mix with GIS
Alexandros Voukenas explains how to calculate land use mix indices (such as entropy) in a GIS environment.
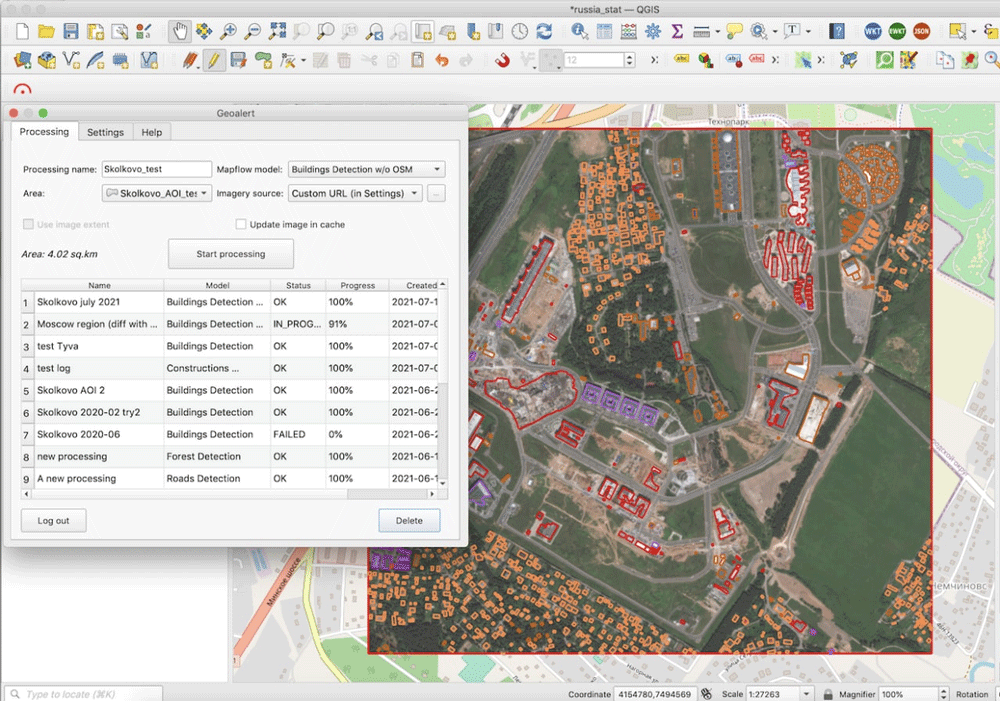
Run AI-Mapping in QGIS over high-resolution satellite imagery
Mapflow is a QGIS plugin that lets users extract real-world objects from satellite imagery.