
Articles

Circumhorizontal Arc: Rainbow in the Clouds
When conditions are just right, clouds can act like prisms, turning the rays of the sun into a brilliant color show.

Cartographic Resources
Discover effective spatial data display and map design. Access resources on color representation, map layout, and showcasing geospatial information.

Early Wildfires in New Mexico
Wildfires in New Mexico are are starting earlier each year due to warmer and drier conditions.

Reliability of Machine Learning Maps
Academics are increasingly adopting machine learning maps to better understand what can happen for a range of environmental events.

Fluid Earth: Open-source Visualization of Weather and Climate Data
Fluid Earth is a web visualization tool developed by The Ohio State University's Byrd Polar and Climate Research Center (BPCRC) that enables users to view weather and climate patterns.

Measuring Nitrogen Dioxide Levels in Urban Zones using Geospatial Methods
Earth observation and geospatial techniques have improved the ability to measure nitrogen dioxide at ground level.

Big Data and Animal Migration
Scientists are using big data methods combined with modern GPS tracking and machine learning to enhance their understanding of global animal migration patterns.

Geography Facts About the Atlantic Ocean
The Atlantic Ocean, named after the Greek god Atlas, is the second-largest ocean in the world.

Higher Resolution U.S. Flood Maps
Researchers have developed a high resolution flood map for the United States.

Book Review | The Cartographers
The Cartographers by Peng Shepherd is a suspense novel with a cartographic twist.
GIS Job Definitions
What are the different types of geospatial job listings out there? Listed here is the list of different GIS, which ...

Bewick’s Wren
The Bewick's Wren (Thryomanes bewickii) is a small songbird native to North America.

Mapping the Sounds of the Ocean
Using hydrophones, scientists convert sound waves to electrical signals to create images of underwater ocean environments.

Turning Geospatial Skills Into a Business
Those with GIS and geospatial skills have a variety of options for launching their own businesses.

Lidar Explained
Lidar is a technology developed to map the elevation of features on and below the surface of the Earth.

Extracting Geospatial Data from Historical Maps
Geospatial methods can detect location names from historical maps, make them searchable, and allow for the automated extraction of geographic data from those maps.

Geography of the United States
Extreme temperatures, topography, wind, and other powerful natural forces have shaped the geography of the United States.
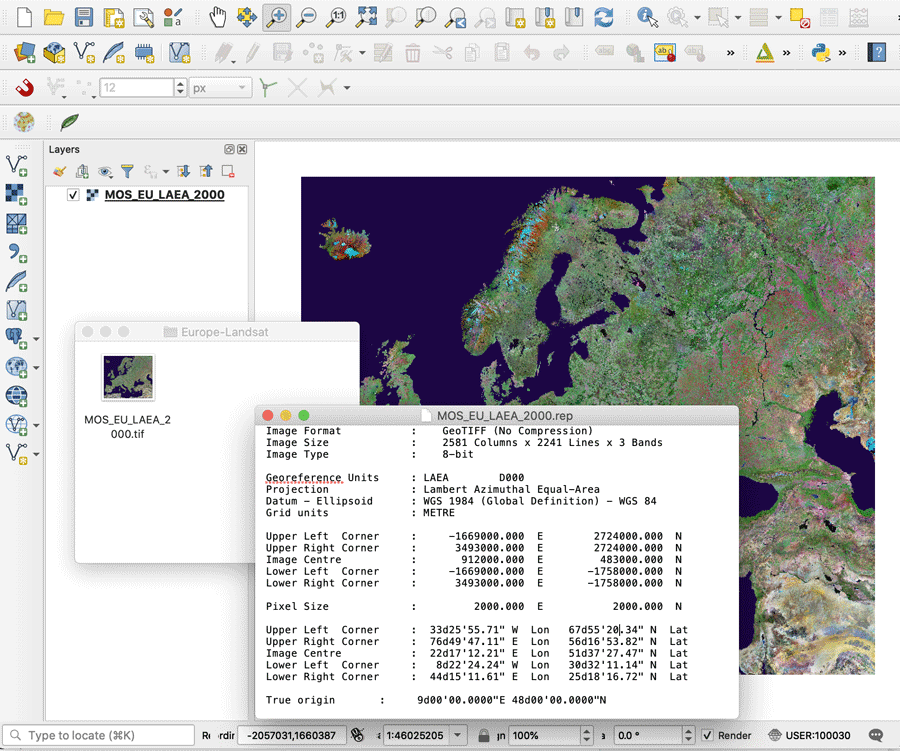
What is a GeoTIFF?
A GeoTIFF is a public domain metadata standard which has the georeferencing information embedded within the image file.

How to Use ArcGIS Pro to Estimate Soil Erosion from a Catchment Basin
This lesson shows how to use spatial data science and remote sensing techniques in ArcGIS Pro to predict soil erosion in a catchment area using the Universal Soil Loss Equation (USLE).

The Many Uses of Aerial Imagery
Nearmap's Tony Agresta outlines the many applications of aerial imagery, including assessing damage after a disaster, reducing crime, valuing properties, and more.

ZIP Codes in the United States
It’s likely that if you routinely send mail to a location within the United States, you know how critical it ...
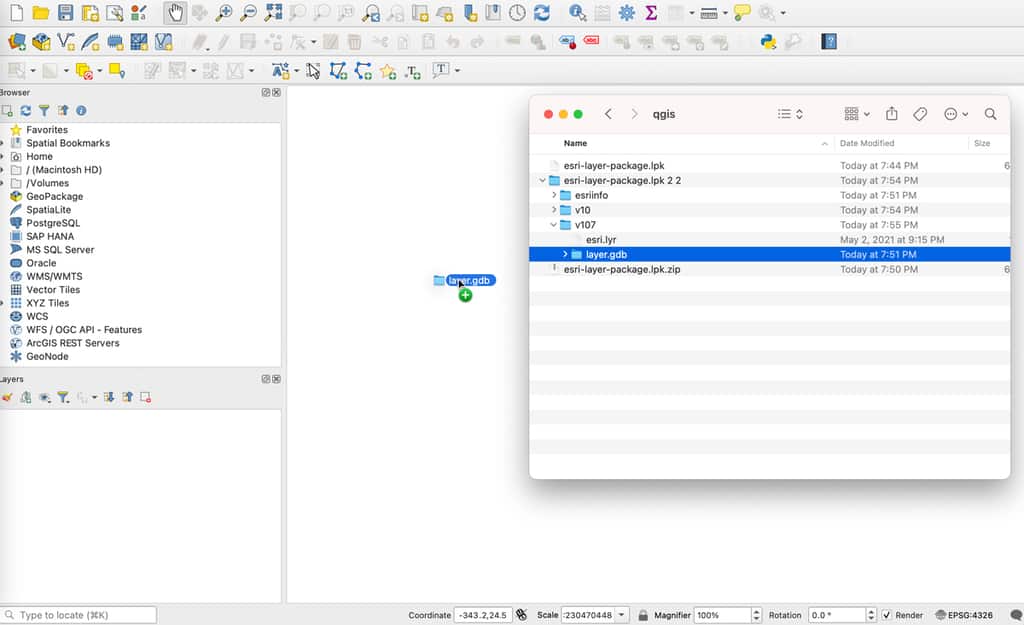
How to Import an Esri Layer Package in QGIS
While QGIS cannot directly read an Esri layer package, there is a simple technique to unpack the file and import it into this GIS software.


Geography of Saharan Dust: Where and How Does it Travel?
The Saharan Desert produces vast amounts of atmospheric dust, which is carried and deposited thousands of kilometers away by strong winds traveling over great distances.

Kriging in Geography
Spatial kriging is a commonly used interpolation technique for estimating raster values.

GOES-T: Next Generation Weather and Space Monitoring
The launch of the GOES-T (GOES-18) satellite provides coverage for the United States' West Coast, Hawaii, and Alaska.